FIGURE

Figure 7

ID
ZDB-FIG-200220-15
Publication
Gierten et al., 2020 - Automated high-throughput heartbeat quantification in medaka and zebrafish embryos under physiological conditions
Other Figures
All Figure Page
Back to All Figure Page
Figure 7

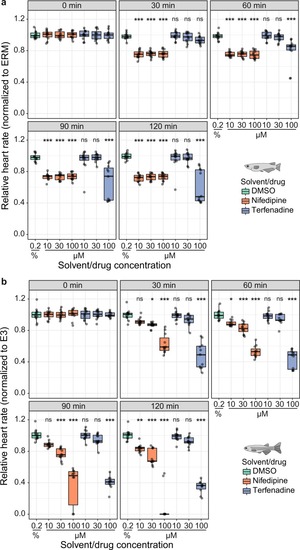
Heart rate inhibition by nifedipine and terfenadine over time. (a) Time course of drug effects revealing heart rate inhibition in medaka embryos (102–104 hpf) by nifedipine and 100 µM terfenadine (n = 11–12 each for DMSO, terfenadine 10/30/100 µM, nifedipine 10/30/100 µM at every time point). (b) Concentration-dependent heart rate decrease by nifedipine and terfenadine in zebrafish (32–34 hpf; n = 10–12 for all treatment and control groups at every time point). Significant difference between each drug concentration and the time-matched DMSO control group were tested with one-way ANOVA and pairwise comparisons using Student’s t-test and are given with *P < 0.05, **P < 0.01 and ***P < 0.001, ns (not significant); data is visualized as box plots (median ± interquartile range) and scatter plots of original data points. At all points in time, each heart rate measurement of one of the treatment groups is normalized to the mean heart rate of a control group in fish medium (ERM/medaka, E3/zebrafish; data not shown) to account for stage-dependent changes and is expressed relative to the corresponding baseline treatment group mean (time point 0).

Expression Data

Expression Detail
Antibody Labeling
Phenotype Data

Phenotype Detail
Acknowledgments
This image is the copyrighted work of the attributed author or publisher, and ZFIN has permission only to display this image to its users. Additional permissions should be obtained from the applicable author or publisher of the image. Full text @ Sci. Rep.