
FIGURE
Figure 4
- ID
- ZDB-FIG-200125-10
- Publication
- Koiwa et al., 2019 - Generation of a Triple-Transgenic Zebrafish Line for Assessment of Developmental Neurotoxicity during Neuronal Differentiation
- Other Figures
- All Figure Page
- Back to All Figure Page
Figure 4
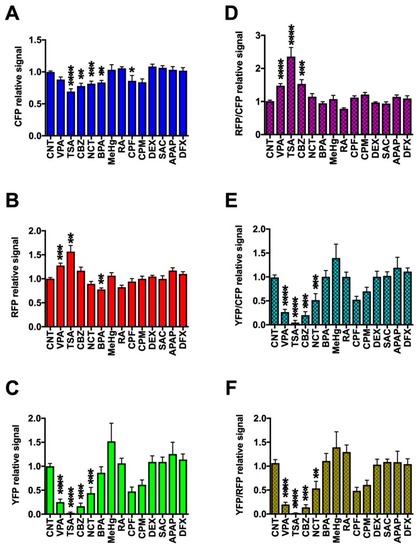
Quantification of in vivo fluorescence imaging of triple-Tg zebrafish exposed to chemicals at the maximum tolerable concentrations during early development. Triple-Tg zebrafish were treated as described for |
Expression Data
Expression Detail
Antibody Labeling
Phenotype Data
Phenotype Detail
Acknowledgments
This image is the copyrighted work of the attributed author or publisher, and
ZFIN has permission only to display this image to its users.
Additional permissions should be obtained from the applicable author or publisher of the image.
Full text @ Pharmaceuticals (Basel)