
Image
|
Figure Caption
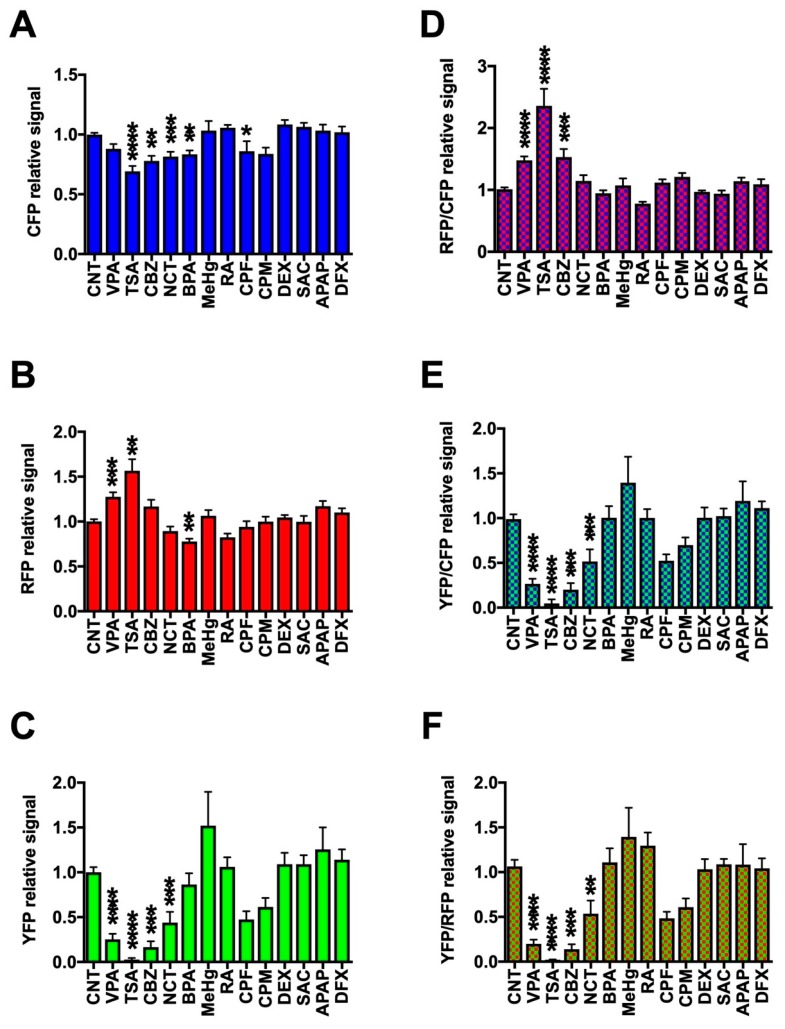
Figure 4
Quantification of in vivo fluorescence imaging of triple-Tg zebrafish exposed to chemicals at the maximum tolerable concentrations during early development. Triple-Tg zebrafish were treated as described for
Acknowledgments
This image is the copyrighted work of the attributed author or publisher, and
ZFIN has permission only to display this image to its users.
Additional permissions should be obtained from the applicable author or publisher of the image.
Full text @ Pharmaceuticals (Basel)