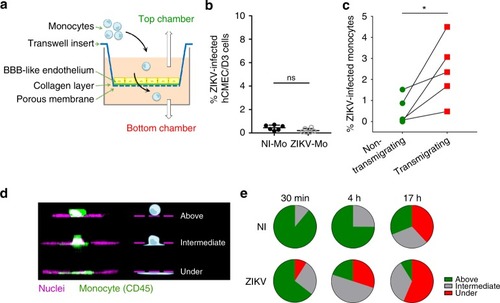
ZIKV-infected monocytes exhibit higher transmigration properties. a Representative scheme of the transwell transmigration assay. b After a transmigration assay was performed, the hCMEC/D3 monolayer was harvested from the transwell membrane, fixed, and processed for flow cytometry. The cells were stained with a NS2B antibody to assess for viral infection. The graph shows the mean ± SD of two independent experiments done in triplicate with two donors. c Monocytes were noninfected or infected with ZIKV at MOI 1 for 48 h. Upon extensive washes, monocytes were added on top of a transwell insert onto which hCMEC/D3 endothelial cells were plated 7 days before addition. Transmigration was allowed to occur for ≈17 h. Monocytes from the top and bottom chambers were harvested, fixed, and stained. Flow cytometry analysis was performed to determine the percentage of ZIKV-infected cells (NS2B+) among the monocytes that did not transmigrate (top, green circles) or did transmigrate (bottom, red squares). The graph shows two individual experiments from three donors. One of the replicates was not presented, because no infected cells were detected in the top or bottom chambers (see Source Data file for details). Monocytes from the top and bottom come from the same transwell. The fold change of the percentage of infected cells in the top and bottom chambers was significantly greater (two-way Anova = 0.039). d–e ZIKV-infected or noninfected (NI) monocytes isolated from two donors were cocultured for 17 h with a hCMEC/D3 monolayer previously grown on glass coverslips for 7 days. Upon fixation and staining with a fluorescently labeled anti-CD45 antibody, the number of monocytes located above, intermediate, or under the endothelial layer (as depicted in d) was quantified by confocal microscopy. e The pie charts correspond to the number of monocytes counted per ten fields of view from two individual experiments with two donors. Two-tailed p value < 0.05 (*). Statistical significance was determined by using a t test. NI noninfected, ns nonsignificant. Source data in b, c, e are provided as a Source Data file
|
