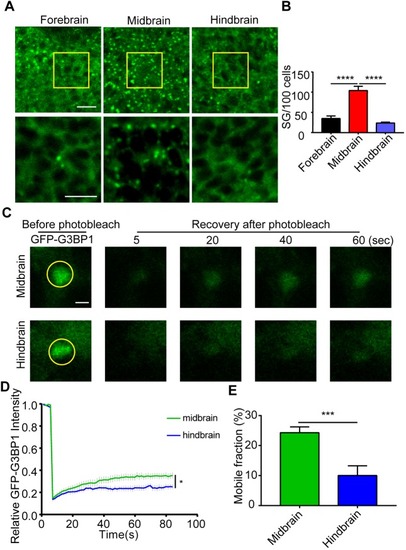
Stress granule formation varies in different brain regions. (A) Ten-minute heat shock-induced stress granules in the forebrain, midbrain and hindbrain region in 1 dpf GFP–G3BP1 knock-in zebrafish. The yellow boxed areas were enlarged and shown in the lower panels. Scale bars: 10 µm. (B) Quantification of stress granules (sized ≥0.1 µm) formed in cells from each region. Cells quantified were at the same depth (20 µm under the epidermis) in each region to minimize any potential difference due to heat conductance. Values represent mean±s.e.m., n=5 zebrafish, 100–120 cells per field. ****P≤0.0001 by unpaired Student's t-test. (C–E) Stress granule dynamics in heat-shocked cells from midbrain and hindbrain in 1 dpf GFP–G3BP1 knock-in zebrafish. After removal of heat shock, selected stress granules were analyzed using FRAP. All the stress granule-positive cells analyzed using FRAP were at the same depth (10 µm under epidermis). (C) Representative images of the stress granules before and after photobleaching at different times. Scale bar: 2 µm. (D) Signal intensity of GFP fluorescence from FRAP. The average fluorescence intensity before photobleaching was designated as 1. (E) Mobile fraction calculated from the FRAP analysis in D. Values in D,E represent mean±s.e.m. For each brain region, 14–15 cells from 5–6 zebrafish were analyzed. *P≤0.05, ***P≤0.001 by unpaired Student's t-test.
|
