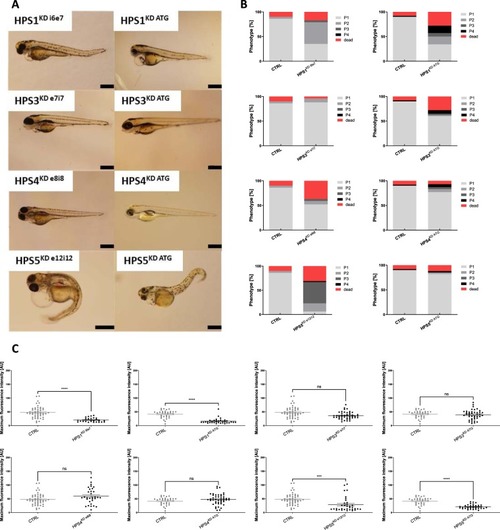
Phenotype evaluation and renal protein loss determination after induction of HPS1KD, HPS3KD, HPS4KD and HPS5KD in zebrafish. (A) The larval phenotype was analyzed at 96 hpf following HPSKD at the 1–2 cell stage. Both HPS1KD i6e7 and HPS1KD ATG larvae showed pericardial effusion and yolk sac edema and a slight curvature of the tail. HPS3KD e7i7 and similarly HPS3KD ATG embryos revealed mild pericardial effusion without yolk sac edema and a straight tail. A similar effect of the knockdown was detected in both the HPS4KD e8i8 and HPS4KD ATG groups which showed no pericardial effusion, yolk sac edema while a straight tail occurred. The HPS5KD e12i12 led to the most severe pericardial effusion, yolk sac edema and tail curvature, and the HPS5KD ATG caused a milder degree of pericardial effusion, yolk sac edema but a tail curvature, while CTRL-MO injected larvae showed no signs of an abnormal phenotype. Scale bar = 500 µm. (B) Phenotypic changes, indicating glomerular filtration barrier impairment, were determined by grading each larva at 96 hpf in terms of severity of pericardial effusion and yolk sac edema. Applying this grading system, a physiological appearance was scored as a P1 while the most severe edema and pericardial effusion was scored as P4. The number of dead larvae at 96 hpf is also stated. Both HPS1KD i6e7 and HPS1KD ATG resulted in either death or aberrance from the normal P1 condition in more than 50%, while a P2 phenotype in HPS1KD i6e7 and the P1 was in HPS5KD ATG were the most prominent. HPS3KD e7i7 did not show phenotypic changes in comparison with the control group, while the HPS3KD ATG showed a higher death rate but only mild to severe aberration in a minority of the larvae in comparison with the control group. In both HPS3KD e7i7 and HPS3KD ATG larvae, a P1 phenotype was the most common. The HPS4KD e8i8 induced a higher death rate but only mild aberration in some larvae from the normal phenotype in comparison with the control group. The HPS4KD ATG showed a similar death rate compared to the control while only the minority of larvae displayed a varying degree of aberration. HPS5KD e12i12 resulted in either death or deviated from the normal P1 condition in more than 50% of the cases, the P3 was in HPS5KD e12i12 the most prominent phenotype. The HPS5KD ATG showed overall similar results as the control group. (C) Quantification of maximum fluorescence intensity in the retinal vessel plexus of a Tg(l-fabp:eGFP-DBP) transgene zebrafish line depicted in arbitrary units (AU). Scatterplot presenting maximum fluorescence intensity of the fish eye was analyzed with ImageJ. All HPSKD groups were compared with the CTRL-MO injected group. HPS1KD i6e7, HPS1KD ATG, HPS5KD e12i12 and HPS5KD ATG led to a decrease of fluorescence intensity, while HPS3KD e7i7, HPS3KD ATG, HPS4KD e8i8 and HPS4KD ATG did not induce a reduction of fluorescence intensity. At least 26 animals were measured for each condition. The error bars indicate the mean ± SEM. n.s. = p ≥ 0.05, ***p ≤ 0.001, ****p ≤ 0.0001 by one-way ANOVA followed by Tukey’s multiple comparisons test.
|
