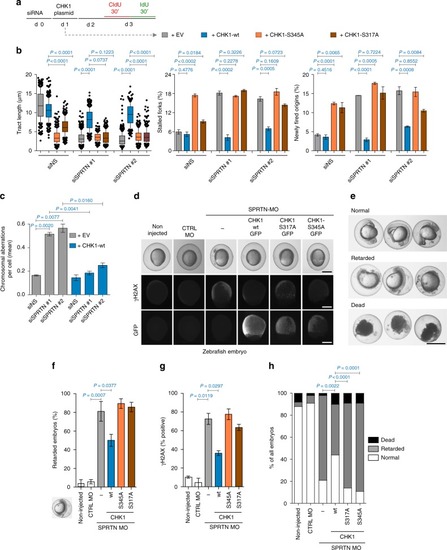
Ectopic CHK1 overexpression rescues SPRTN-deficiency phenotypes. a Experimental strategy followed to assess the effect of different CHK1 variants on DNA replication by DNA fiber assay (d: day, EV: empty vector). b Rescue of DNA replication defects in SPRTN-depleted HEK293 cells with ectopic expression of CHK1-wt, but not with the phospho-deficient CHK1 variants. Graphs show quantification data from DNA fibers for replication fork velocity (left panel; mean ± 25–75 percentile range (box) ± 10–90 percentile range (whiskers)), newly fired origins (centre panel; mean ± SEM) and stalled replication forks (right panel; mean ± SEM); >100 DNA fibers were analysed per condition and experiment; n = 3 independent replicates, two-tailed Student's t-test. c Overexpression of CHK1-wt diminishes the number of chromosomal aberrations caused by SPRTN knock-down visualised by metaphase spreads from HEK293 cells. >30 cells were scored per condition per experiments; mean ± SEM; n = 3 individual experiments, two-tailed Student's t-test. d Representative images of zebrafish embryos non-injected or injected with either a control or a previously characterised morpholino (MO) against SPRTN at 9–10 h post fertilization (hpf). To assess CHK1 function, capped RNA encoding different mutants of GFP-tagged human CHK1 were co-injected with the SPRTN MO. Upper row: live images. Middle row: pictures of γH2AX to show DNA damage. Lower row: Pictures of GFP to show expression of CHK1 protein variants. e Representative images for normal, retarded and dead zebrafish embryos at 24 hpf. Scale bar = 500 µm. f–h Overexpression of CHK1-wt, but not of the phospho-deficient CHK1 variants, rescues developmental defects and DNA damage induced by SPRTN depletion in zebrafish embryos. Percentage of zebrafish embryos that show developmental retardation relative to living embryo are represented in (f) (mean ± SEM; >70 embryo were scored in n = 4 independent experiments, two-tailed Student's t-test), whereas data scoring normal, retarded and dead zebrafish embryos are represented in (h), Fisher’s exact test. γH2AX, marker of DNA damage, is represented in (g) (mean ± SEM; at least 30 GFP-positive embryos were counted per condition; n = 2 replicates, two-tailed Student's t-test). Source data for (b, c, f–h) are provided as a Source Data file
|
