
FIGURE
Fig. S3
- ID
- ZDB-FIG-190821-31
- Publication
- Aripaka et al., 2019 - TRAF6 function as a novel co-regulator of Wnt3a target genes in prostate cancer
- Other Figures
- All Figure Page
- Back to All Figure Page
Fig. S3
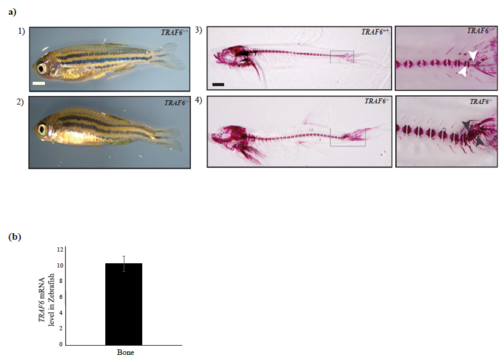
(a) (1-2) Images representing the phenotypic differences between TRAF6+/+ and TRAF6−/− fishes at 50dpf. (3-4) Whole-mount in-situ Alizarin red staining of TRAF6+/+ and TRAF6−/− fishes at 50dpf. Boxes indicate area of enlargement on the right. White arrows indicate normal areas and black arrows indicate affected areas in vertebrae. Images were taken using a Nikon SMZ1500 stereomicroscope and a Nikon D5200 digital camera. Scale bar 2 mm. (b) mRNA expression levels of TRAF6 in bone tissue in 60 dpf wild-type zebrafish (n = 4 WT fish). Bar graphs show the means ± SEM. |
Expression Data
| Gene: | |
|---|---|
| Fish: | |
| Anatomical Term: | |
| Stage: | Adult |
Expression Detail
Antibody Labeling
Phenotype Data
| Fish: | |
|---|---|
| Observed In: | |
| Stage: | Adult |
Phenotype Detail
Acknowledgments
This image is the copyrighted work of the attributed author or publisher, and
ZFIN has permission only to display this image to its users.
Additional permissions should be obtained from the applicable author or publisher of the image.
Full text @ EBioMedicine