
Fig. 11
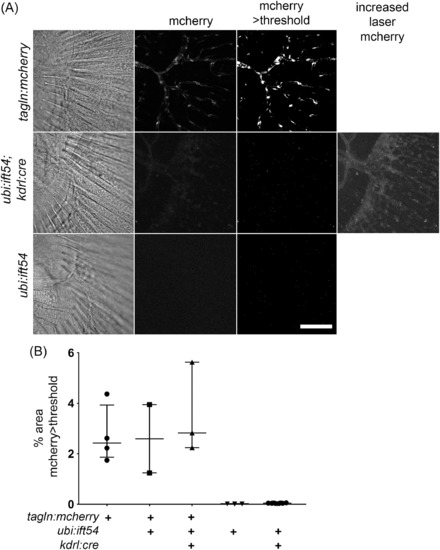
Endothelial‐specific excision of the Tg(ubi:loxP‐ift54‐loxP‐myr‐mcherry,myl7:EGFP)sh488‐rescuing transgene causes no apparent further impairment to tagln‐expressing perivascular mural cells in ift54 tp49; Tg(ubi:loxP‐ift54‐loxP‐myr‐mcherry,myl7:EGFP)sh488 fish expressing a Tg(tagln:mcherry)sh441 transgene. A: Confocal stack projections showing mcherry fluorescence from 14‐dpf caudal fins of Tg(tagln:mcherry)sh441 /+ (tagln:mcherry), Tg(ubi:loxP‐ift54‐loxP‐myr‐mcherry,myl7:EGFP)sh488 /+;Tg(kdrl:cre)s898 (ubi:ift54;kdrl:cre), and the control background fluorescence signal from unrecombined sibling Tg(ubi:loxP‐ift54‐loxP‐myr‐mcherry,myl7:EGFP)sh488 /+ (ubi:ift54) fish. Also shown are binary threshold processed images as used for quantification of the area of Tg(tagln:mcherry)sh441 /+ expression. Single‐focal‐plane transmitted light views are shown for orientation. The microscope settings suitable for Tg(tagln:mcherry)sh441 /+ detect insignificant fluorescence from Tg(ubi:loxP‐ift54‐loxP‐myr‐mcherry,myl7:EGFP)sh488 /+;Tg(kdrl:cre)s898, but endothelial mcherry is detected at increased laser power. B: Chart showing % of field of view with >threshold mcherry expression as measured from processed confocal projections of caudal fins from fish with the different transgenes as shown in representative examples in A. Overlay shows median and interquartile range. Scale bar A = 100 μm |
| Gene: | |
|---|---|
| Fish: | |
| Anatomical Term: | |
| Stage: | Days 14-20 |