
Fig. 5
- ID
- ZDB-FIG-190806-37
- Publication
- Baek et al., 2019 - The Alternative Splicing Regulator Nova2 Constrains Vascular Erk Signaling to Limit Specification of the Lymphatic Lineage
- Other Figures
- All Figure Page
- Back to All Figure Page
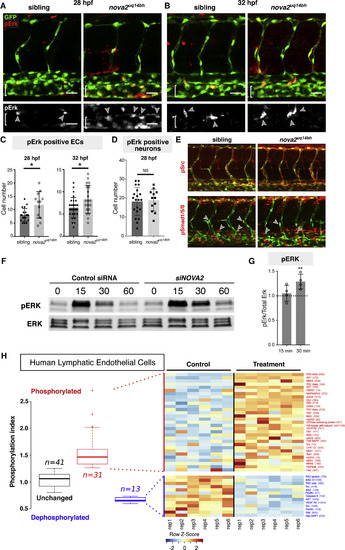
Nova2 Regulates MAPK-ERK Signaling (A and B) Phospho-Erk1/2 (pErk) immunostaining at 28 hpf (A) and 32 hpf (B) in Tg(fli1a:nEGFP)y7 siblings and nova2uq14bh mutants. Arrowheads indicate pErk-positive ECs (brackets indicate PCV). (C) Quantification of the number of pErk-positive ECs in the dorsal side of the PCV across 7 body segments at 28 hpf (siblings n = 20 and mutants n = 12) and 32 hpf (siblings n = 29 and mutants n = 20). (D) Quantification of the number of pErk-positive neurons across 3 body segments at 28 hpf. (siblings n = 20 and mutants n = 12). (E) Representative immunostains (32 hpf) for pSrc (upper, no qualitative differences observed) and for pSmad1/5/8 (lower, in which pSmad-positive arterial ECs and venous ECs were scored in the DA and PCV). No difference in the number of pSmad-positive cells across 4 somites was seen in DA (sib: 3.6 ± 1.6 [SD, n = 9], mut:4 ± 1.3 [n = 10]) or PCV (sib: 1.8 ± 1.5 [n = 9], mut:1.4 ± 1.3 [n = 10]). (F) Western blot analysis of ERK activation upon NOVA2knockdown in HuLECs stimulated with VEGFC. Representative of four independent blots, lower bands non-specific in both blots. (G) Quantitative analysis of normalized pERK expression (pErk/total Erk) relative to control siRNA levels from (F) shows prolonged activation of ERK at 30 min following VEGFC treatment. (H) Summary of phosphoarray analysis from human LECs. Left: Summary of overall experimental outcome with n = 41 unchanged phospho-sites, n = 31 increased phosphorylation events and n = 13 dephosphorylationevents. Right: Representative heat map of phosphoarray outcome. Increased and decreased phosphorylation events and targets are indicated. Data generated from n = 2 independent arrays with 6 independent assays for each Ab on each array. Error bars: SD, Scale bars: 25 μm, t test (D and G) or Mann-Whitney-test (C), ∗p < 0.05, ∗∗p < 0.01, and ns, not significant. See also Figure S5. |
| Gene: | |
|---|---|
| Antibodies: | |
| Fish: | |
| Anatomical Term: | |
| Stage Range: | Prim-5 to Prim-15 |
| Fish: | |
|---|---|
| Observed In: | |
| Stage Range: | Prim-5 to Prim-15 |
Reprinted from Developmental Cell, 49, Baek, S., Oh, T.G., Secker, G., Sutton, D.L., Okuda, K.S., Paterson, S., Bower, N.I., Toubia, J., Koltowska, K., Capon, S.J., Baillie, G.J., Simons, C., Muscat, G.E.O., Lagendijk, A.K., Smith, K.A., Harvey, N.L., Hogan, B.M., The Alternative Splicing Regulator Nova2 Constrains Vascular Erk Signaling to Limit Specification of the Lymphatic Lineage, 279-292.e5, Copyright (2019) with permission from Elsevier. Full text @ Dev. Cell