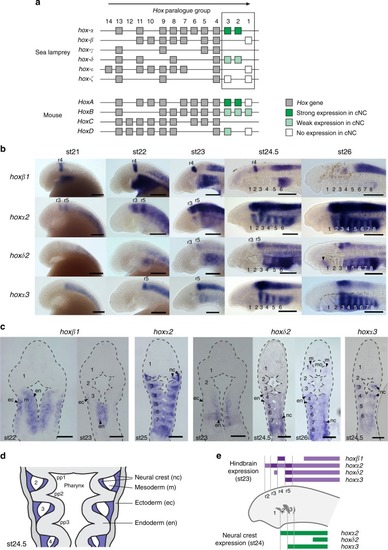
Embryonic time course showing expression of hox genes in the lamprey hindbrain and cranial neural crest (NC). a Genomic organization of Hox genes in lamprey and mouse. Boxes represent Hox genes, which are organized into paralogue groups based on their sequence. The arrow above the clusters denotes the direction of Hox gene transcription. Lamprey hox genes from paralogue groups 1–3 were examined for NC expression in this study and their expression in cranial NC is denoted by green/white shading. b Lateral views of lamprey embryos from stages (st)21 to 26, showing hox gene expression domains in the developing head. Pharyngeal arches are numbered and rhombomere-specific domains (r) indicated. The arrowhead marks weak hoxδ2 expression in mandibular mesoderm at st26. c Frontal sections through lamprey embryos showing hox gene expression domains within the developing pharynx. Pharyngeal arches are numbered. d Schematic of a frontal section through the lamprey st24.5 embryonic pharynx with tissue domains annotated; NC domains are shaded in blue. Scale bars: 200 μm (b); 100 µm (c). e Schematic depicting hox expression in the lamprey hindbrain and NC at st23 and st24. ec, ectoderm; en, endoderm; m, mesoderm; mo, mouth; nc, neural crest; r, rhombomere; st, stage
|
