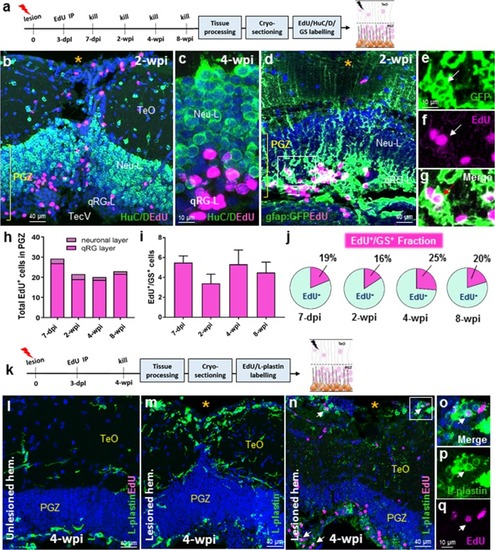
Differentiation post-lesion in activated qRG of the qRG-layer. (a) Experimental design to study differentiation of proliferating radial-glia (pRG) at chase periods post-EdU injection. (b,c) Low and high magnification examples displaying the absence of co-labelling of EdU+ cells (pink) in the PGZ with the neuronal marker, HuC/D (green) at 2-wpi (b) and 4-wpi (c). (d–g) Representative images of co-labelling of EdU+/gfap:GFP+ cells in the qRG layer (qRG-L) of the PGZ at 2-wpi. White box in (d) shown at higher magnification and in separate channels confirming co-labelling of pRG with EdU (e–g; white arrows). (h) Total EdU+ cells in the upper neuronal layer and deeper qRG layer at consecutive chase periods (one-way ANOVA; F (3, 35) = 2.239, p = 0.1009; Tukey’s multiple comparisons test: 7-dpi vs 2-wpi, p = 0.2082; 7-dpi vs 4-wpi, p = 0.1072; 7-dpi vs 8 wpi, p = 0.3333; 2-wpi vs 4-wpi, p = 0.9863; 2-wpi vs 8-wpi, p = 0.9984; 4-wpi vs 8-wpi, p = 0.9621). Standard error of the mean for total EdU+ cells (neuronal layer + qRG layer): 7-dpi ± 2.4; 2-wpi ± 2.9; 4-wpi ± 2.7; 8-wpi ± 3.5. (i) Quantification of EdU+/GS+ cells at increasingly longer chase periods post tectal lesion in the qRG layer (one-way ANOVA; F (3, 17) = 0.7972, p = 0.5123; Tukey’s multiple comparisons test: 7-dpi vs 2-wpi, p = 0.5190; 7-dpi vs 4-wpi, p = 0.9994; 7-dpi vs 8- wpi, p = 0.9232; 2-wpi vs 4-wpi, p = 0.5845; 2-wpi vs 8-wpi, p = 0.9107; 4-wpi vs 8-wpi, p = 0.9533). (j) Fraction of EdU+/GS+ cells as a percentage of the total EdU+ population in the PGZ at four chase periods examined. (k) Experimental design to examine the contribution of macrophages, using the L-plastin antibody (green), to cell proliferation at the site of injury at 4-wpi. (l) The unlesioned hemisphere displays a small number of non-proliferative resident microglia in the TeO and PGZ. (m) A large population of amoeboid-like macrophages are observed in the TeO surrounding the tectal lesion site, with L-plastin staining in the PGZ resembling the unlesioned condition. Co-labelling with EdU (pink) reveals a population of L-plastin+ cells that are in a proliferative state (white arrows). White box is shown in higher magnification in panels o,p. (o,p) Merge and single channels showing a representative L-plastin+/EdU+ cell (white arrow) adjacent the lesion site at 4-wpi. Experimental replicates were combined for all statistical analyses. All data presented are mean ± S.E.M. Significance was accepted at *p < 0.05. Orange asterisk (*) denotes the lesion site in (b,d,m,n). In panels b–d, l–o, DAPI nuclear counterstaining (blue) was performed. In all cross-sectional images dorsal is oriented up. dpl, days post lesion; dpi, days post EdU injection; wpi, weeks post EdU injection.
|
