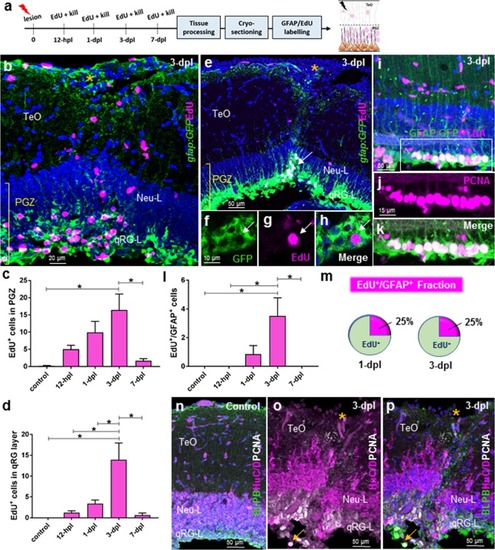
Cell proliferation post-lesion in the qRG layer of the periventricular grey zone (PGZ; stem cell zone 1). (a) Experimental design to investigate EdU proliferation arising from the qRG populations. (b) Example of the proliferative response at the lesion site (orange asterisk) in the PGZ (high proliferation) and superficial layers (modest proliferation) at 3-dpl when response is maximal. (c) Total EdU+ cells in the PGZ (Neu-L + qRG-L) at times post-lesion. One-way ANOVA; F (4, 23) = 4.395, p = 0.0087; Tukey’s multiple comparisons test: 3-dpl vs control, p = 0.0109; 3-dpl vs 7-dpl, p = 0.0365. (d) Total EdU+ cells in the qRG layer at times post-lesion. One-way ANOVA; F (4, 24) = 8.585, p = 0.0002; Tukey’s multiple comparisons test: 3-dpl vs control, p = 0.0005; 3-dpl vs 12-hpl, p = 0.0008; 3-dpl vs. 1-dpl, p = 0.0031; 3-dpl vs 7-dpl, p = 0.0018. (e) Example of a population of co-labelled gfap:GFP+/EdU+ cells in the qRG layer of the PGZ at 3-dpl (qRG-L, white arrow). High magnification view of proliferating radial-glia (pRG) in separate GFP (f) and EdU (g) channels, and merge (h) at 3-dpl. (i–k) Co-labelled population of gfap:GFP+/PCNA+ pRG lining the tectal ventricle at 3-dpl. White box in (i) denotes images shown in (j and k). (l) Total EdU+/GFAP+ proliferating radial-glial (pRG) cells arising from activated qRG at times post-lesion. One-way ANOVA; F (4, 22) = 4.479, p = 0.0085; Tukey’s multiple comparisons test: 3-dpl vs control, p = 0.0308; 3-dpl vs 12-hpl, p = 0.0133; 3-dpl vs. 1-dpl, p = 0.0707; 3-dpl vs 7-dpl, p = 0.0308. (m) Fraction of EdU+/GFAP+ cells as a percentage of the total EdU+ population in the PGZ at 1-dpl and 3-dpl. (n,o) Double-labelling of PCNA with the pan-neuronal marker HuC/D demonstrating an absence of PCNA+/HuC/D+ cells under control condition (n) and at 3-dpl (o,p) in the densely populated neuronal layer (Neu-L). Co-labelling of PCNA and basic lipid binding protein (BLBP) can be observed as previous in the qRG-layer (qRG-L; yellow arrow). Experimental replicates were combined for all statistical analyses. All data presented are mean ± S.E.M. Significance was accepted at p < 0.05 and is denoted by an asterisk. In panels b,e,h,i,n,p DAPI nuclear counterstaining (blue) was performed. In all cross-sectional images dorsal is oriented up. hpl, hours post lesion; dpl, days post lesion.
|
