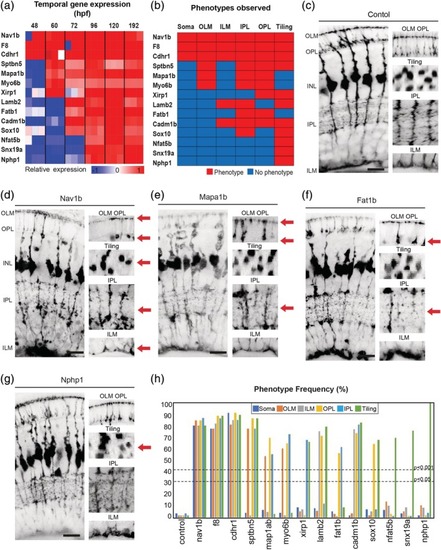
Temporal gene expression dictates MG cell morphologies. (a) Heatmap to show the relative gene expression for genes tested. (b) Summary of phenotypes observed for genes enriched across windows of MG cell differentiation. Red—phenotype, blue—no‐phenotype. (c) slc24a5 CRISPR injected control animals have normal MG cell morphology that extends from the apical to the basal surfaces, forming the ILM (inner limiting membrane) and OLM (outer limiting membrane) on either side. MG cells are also regularly tilled across in the eye with their cell bodies mostly restricted to the middle of the INL (inner nuclear layer) and are highly branched within the IPL (inner plexiform layer) and OPL (outer plexiform layer). (d) nav1b CRISPR injected animals have defects in apico‐basal cell body position in the INL (inner nuclear layer), OLM (outer limiting membrane), OPL (outer plexiform layer), tiling, IPL (inner plexiform layer), and ILM (inner limiting membrane). (e) mapab1 CRISPR injected animals have defects in OLM, OPL, and IPL. (f) fat1b CRISPR injected animals have defects in OPL and IPL defects. (g) nphp1 CRISPR injected animals have defects in MG cell tiling. (h) Frequency (%) of phenotypes observed in each MG compartment in F0 CRISPR screen 1. Scale bars = 8μm
|
