
Fig. 4
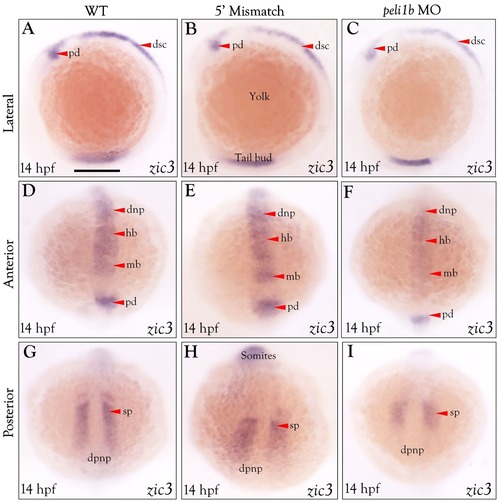
WISH distribution analysis of zic3 in peli1bknockdown embryos at 14 hpf. Lateral view of zebrafishembryos (A–C). Anterior view (D–F). Posterior view (G–I). WT embryos (A, D, & G), 5′ mismatch controls (B, E, & H), and peli1b morphants injected with 10 ng morpholino at the 1-cell stage (C, F, & I). Red arrowheads show zic3expression and intensity in WT, 5′ mismatch, and peli1bmorphants. (n = 3). Abbreviations: pd- posterior diencephalon, dsc- dorsal spinal cord, dnp- dorsal neural plate, hb- hindbrain, mb- midbrain, dpnp-dorsal posterior neural plate, sp-segmental plate. Scale bar- 50 μm. (For interpretation of the references to color in this figure legend, the reader is referred to the web version of this article.) |
| Gene: | |
|---|---|
| Fish: | |
| Knockdown Reagent: | |
| Anatomical Terms: | |
| Stage: | 10-13 somites |
| Fish: | |
|---|---|
| Knockdown Reagent: | |
| Observed In: | |
| Stage: | 10-13 somites |
Reprinted from Gene, 694, Kumar, A., Anuppalle, M., Maddirevula, S., Huh, T.L., Choe, J., Rhee, M., Peli1b governs the brain patterning via ERK signaling pathways in zebrafish embryos, 1-6, Copyright (2019) with permission from Elsevier. Full text @ Gene