
Fig. 1
- ID
- ZDB-FIG-190627-23
- Publication
- Campo-Paysaa et al., 2019 - Generation of the squamous epithelial roof of the 4th ventricle
- Other Figures
- All Figure Page
- Back to All Figure Page
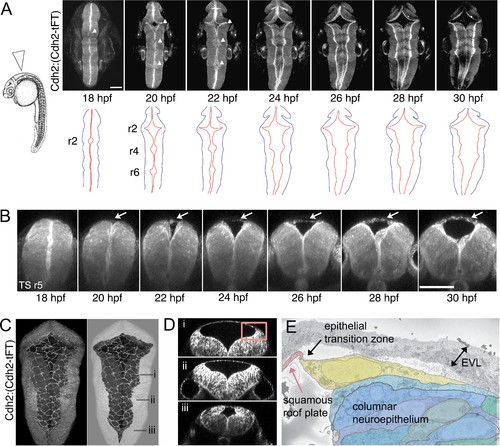
(A) Left. Diagram of 24 hpf zebrafish in lateral view. Arrowhead indicates location of hindbrain roof plate covering fourth ventricle and angle of imaging for time-lapse sequence. Right. Selected frames from time-lapse of Cdh2:(Cdh2-tFT) embryo (n = 15) tracking opening and expansion of fourth ventricle from 18 hpf to 32 hpf (see also Figure 1—video 1). White arrowheads on photomicrographs indicate the three points at which widening commences. Cdh2 is ubiquitous in neural cell membranes and most highly expressed at the ventricular surface. Brightest expression reveals the location of the rhombic lips which sit at interface between columnar neuroepithelium and the periphery of squamous roof plate. Outlines of the neural tube (black) and rhombic lip (red) are shown below. Roof plate widening is initiated in even-numbered rhombomeres (r), 2, 4, 6. (B) Outfolding of dorsal columnar epithelium and de novo appearance of the squamous roof plate (arrows) is revealed in transverse plane time-lapse of ventricle opening at level of rhombomere 5 (Figure 1—video 2). (C) Maximum projection of confocal sections of squamous roof plate and attached columnar epithelium in dorsal view of hindbrain in a 24 hpf Cdh2:(Cdh2-tFT) embryo. Columnar epithelium has been greyed out in right hand image to reveal shape of squamous roof plate. (D) Transverse plane reconstructions through levels indicated in (C) show shape of ventricle and domed squamous roof plate at different anteroposterior levels. (E) Electron micrograph of region indicated by inset in (D) of epithelial transition zone between squamous roof plate (pink) and columnar neuroepithelium of rhombic lip (blue and green). The most dorsal neuroepithelial cell, which abuts the roof plate at the transition zone between tissue architectures, is highlighted in yellow. Images in A-D are from Cdh2:(Cdh2-tFT) embryos. EVL, enveloping layer. Scale bars: 50 μm in A and B. |