
Fig. S3
- ID
- ZDB-FIG-190625-1
- Publication
- Pacentine et al., 2019 - Subunits of the mechano-electrical transduction channel, Tmc1/2b, require Tmie to localize in zebrafish sensory hair cells
- Other Figures
- All Figure Page
- Back to All Figure Page
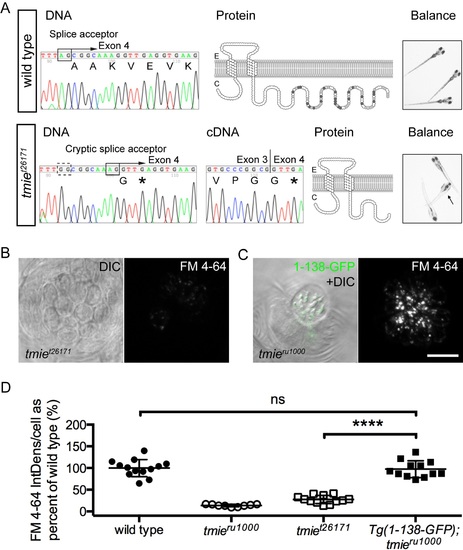
Differential effects on function with a genomic mutation and a transgene mimic.(A) Data for a novel mutant allele of tmie, t26171. DNA: Chromatographs of the DNA sequence of tmie in wild type (above) and tmiet26171 (below) showing the genomic region where the mutation occurs. An arginine is mutated to guanine in the splice acceptor (black box, above) of the final exon of tmie, exon 4. The dashed black box below indicates the mutated original splice acceptor site. Use of a cryptic splice acceptor (black box, below) 8 nucleotides downstream causes a frameshift and an early stop codon (*). cDNA: Chromatograph of the DNA sequence from RT-PCR of tmiet26171 larvae bridging exons 3 and 4. Protein: The predicted protein products, shown here as a two-pass transmembrane protein. The wild type protein has many charged residues (positive in light gray, negative in dark gray) that are lost in tmiet26171. Balance: Photos of wild type and tmiet26171 larvae, taken with a hand-held Canon camera. Arrow points to a larva that is upside-down, displaying a classic vestibular phenotype. (B) Top-down view of a representative neuromast after exposure to FM 4–64, imaged using confocal microscopy. The first panel is a single plane through the soma region while the second panel is a maximum projection of 7 panels through the soma region, beginning at the cuticular plate (as denoted by magenta bracket in Fig 1G). (C) Same as (B) except that the first panel shows the bundle region so that 1-138-GFP can be visualized in bundles (as depicted by dashed green line, Fig 1G). The transgene is driven by the myo6b promoter. (D) Plot of the integrated density of FM fluorescence per cell. We normalized values to the average of wild type siblings. Displayed wild type and tmieru1000 data are from siblings of Tg(1-138-GFP); tmieru1000 and are the same values reported in Fig 6. Data for tmiet26171 is from a separate experiment. Statistical significance determined by one-way ANOVA, ****p<0.0001. Scale bar is 10μm. |