
Fig. 8
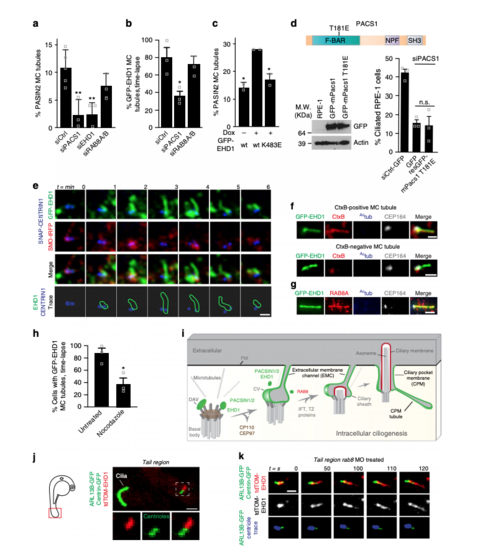
MC-membrane tubules are PACSIN1-, EHD1- and MT-dependent and form in vivo. aQuantification of PACSIN2 positive MC-tubules in cells as in Fig. 6c following siRNAs treatments (siCtrl = 258 cells, n = 5; siPACS1 = 168, siEHD1 = 75, siRAB8A/B = 147 cells, n = 3). b Quantification of GFP-EHD1-positive MC-tubules from triple line treated with siRNAs, starved 3 h and imaged every 2 min for 30 min (siCtrl = 35, siPACS1 = 36, siRAB8A/B = 57 cells, n = 3). c Quantification of MC-tubules from cell lines starved for 3 h and stained with PACSIN2 and CEP164 antibodies (wt −dox = 262, wt +dox = 142, K483E +dox = 177 cells, n = 2). d Schematic of the T181E tubulation defective mutation in the F-BAR domain of mPacsin1 (top). Immunoblot analysis of cells transfected with wildtype- or T181E-mPacsin1 after 6 h of siRNA treatment (bottom left) and ciliation rescue experiment (bottom right, siCtrl = 108, GFP = 71, rescT181E = 85 cells, n = 3). e Images of the 3 h starved triple line taken every minute. Membrane tubules are outlined in green and centrioles in blue (bottom panel, 15 MC-tubules). Single xy planes were smoothed. f Single plane xy epifluorescence images of 3 h starved GFP-EHD1 cells that were CtxB positive (~5% of cells). 53% of GFP-EHD1 MC-tubules contained CtxB (12 MC-tubules). g Images of GFP-EHD1 cells as in f stained with RAB8A, Actub, and CEP164 antibodies (10 cells). Scale bars: 1 μm in (e-g). hQuantification of cells as in b treated with 10 μM Nocodazole (untreated = 38, Nocodazole = 40 cells, n = 3). i Model for intracellular ciliogenesis. DAV distal appendage vesicle, CV ciliary vesicle, IFT intraflagellar transport, TZ transition zone, PM plasma membrane. In a–d and h, means ± SEM and two-tailed t-test analyses are indicated in figure. *P < 0.05, **P < 0.001, non significant (n.s). j Live image of the tail (red box, left schematic) from a 24 hpf embryo showing a tdTom-EHD1 positive MC-tubule (white box, 9 MC-tubules). k Timelapse of MC-tubule formation (centrioles in blue) as in j from embryo injected with rab8 MO (11 MC-tubules). Scale bars: 2 μm in j and k |