
Fig. 3
- ID
- ZDB-FIG-190530-37
- Publication
- Wong et al., 2018 - ERK Activity Dynamics during Zebrafish Embryonic Development
- Other Figures
- All Figure Page
- Back to All Figure Page
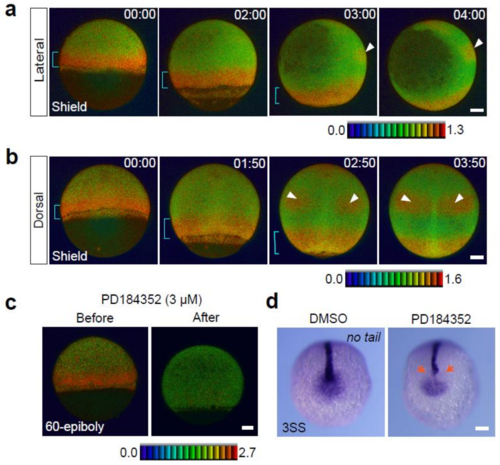
Spatial and temporal map of ERK activity during the gastrula stage. (a) Lateral view, anterior to the top. (b) Dorsal view, anterior to the top. A blue bracket indicates the embryonic margin. White arrowheads mark the future hindbrain. (c) Changes of ERK activity in gastrula stage Teen embryos treated with the MEK inhibitor (3 M PD184352, n = 8). Before, 0 min; after, 60 min. (d) no tail expression in 3SS embryos treated with DMSO (n = 21) or PD184352 (n = 24) for 2 h (from shield to 75-epiboly stages). Inhibition of ERK during the gastrula stages leads to failures of mesodermal cell patterning in notochord and tail bud. Scale bar, 100 m. |