
Fig. 2
- ID
- ZDB-FIG-190530-36
- Publication
- Wong et al., 2018 - ERK Activity Dynamics during Zebrafish Embryonic Development
- Other Figures
- All Figure Page
- Back to All Figure Page
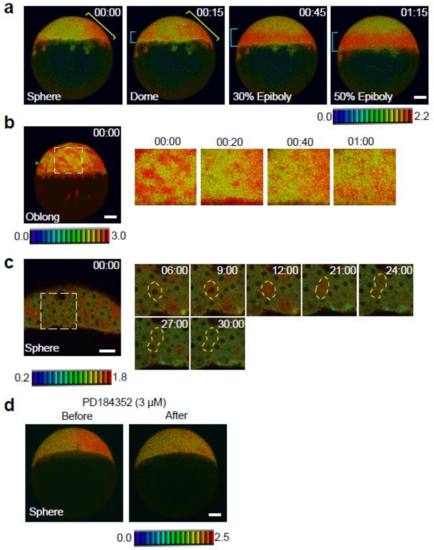
Spatial and temporal map of ERK activity during the late blastula stage. (a) ERK activity dynamics from sphere to 50%-epiboly stages. Lateral view, anterior to the top. Blue and yellow brackets indicate the embryonic margin and future dorsal region, respectively. (b) ERK activity dynamics in the rectangle (white dotted line) from the left panel. Cells migrate towards the vegetal pole, and changes in ERK activation from high to low (or from low to high) can be seen. (c) ERK activation during cell cycle progression. Higher magnification view of the rectangle (white dotted line) in the left panel. Before cell cleavage (M phase), ERK activity increased, whereas it was low in other phases. The yellow dotted line marks the outline of the cell. (d) Changes of ERK activity in sphere stage Teen embryos treated with the MEK inhibitor (3 M PD184352, n = 6). Before, 0 min; after, 60 min. Scale bar, 100 m.
|