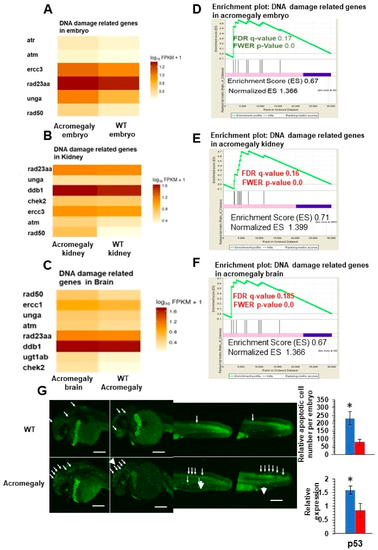
Increased DNA damage in various organs of acromegaly zebrafish model. (A–C) Heatmap of DNA damage markers in acromegaly larvae (3 dpf) (A), acromegaly kidney (one-year-old) (B), and acromegaly brain (one-year-old) (C) versus WT. (D–F) The results of GSEA showing the familywise-error rate (FWER) p-values, false discovery rate (FDR), enrichment scores (ES), and normalized ES of DNA damage markers in acromegaly larvae (3 dpf) (D), acromegaly kidney (one-year-old) (E), and acromegaly brain (one-year-old) (F) versus WT. Significant p-value < 0.05 and FDR q-value < 0.25 are written in red. According to GSEA [15], the reported p-value of 0.0 indicates an actual p-value of less than 0.01 (G) Representative Acridine orange (AO) staining and quantification of acromegaly model and WT larvae. The quantification of AO positive apoptotic cells was performed using Fiji software (left). P53 expression levels in the acromegaly model and WT larvae (right). Data are expressed as the mean ± SE (n = 3). Statistical difference (t-test, P < 0.05) is denoted by an asterisk.
|
