
Fig. 4
- ID
- ZDB-FIG-181024-22
- Publication
- Swaminathan et al., 2018 - Non-canonical mTOR-Independent Role of DEPDC5 in Regulating GABAergic Network Development
- Other Figures
- All Figure Page
- Back to All Figure Page
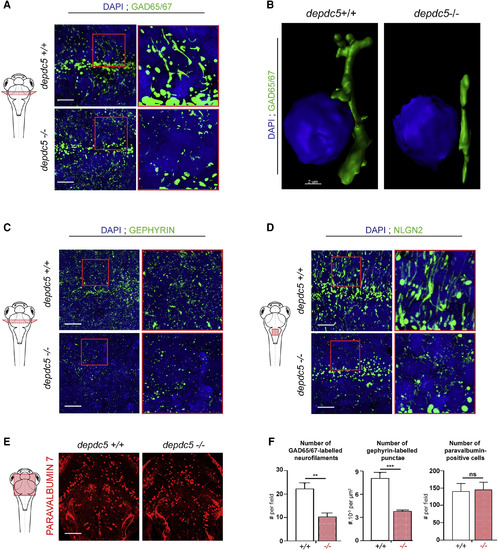
Defects in GABAergic Networks in depdc5 Knockout Zebrafish Brains (A, C, and D) Images of transverse sections of 6-dpf depdc5+/+ and depdc5−/− embryos immunostained with GAD65/67 (A), gephyrin (C), and Nlgn2 (D) antibodies and counterstained with DAPI. Section level is displayed in the schematic drawing. Regions indicated in red boxes have been magnified to show the branching defects; N = 3, n = 3 embryos/genotype. Scale bars, 10 μm. (B) Imaris-reconstructed 3D images with Gad65/67-positive GABAergic boutons shown in green projecting toward the nucleus (DAPI) shown in blue. Scale bar, 2 μm. (E) Images of longitudinal sections of 6-dpf depdc5+/+ and depdc5−/− embryos immunostained with parvalbumin 7 antibody. Scale bar, 25 μm. Field of view is displayed in the schematic drawing. (F) Quantification of the number of GAD65/67-positive neurofilaments, gephyrin-positive puncta, and parvalbumin-positive cells in depdc5+/+ and −/− larval brain sections; N = 3, n > 3 embryos/genotype. |
| Gene: | |
|---|---|
| Antibodies: | |
| Fish: | |
| Anatomical Terms: | |
| Stage: | Day 6 |
| Fish: | |
|---|---|
| Observed In: | |
| Stage: | Day 6 |