
Fig. 7
- ID
- ZDB-FIG-190109-2
- Publication
- Swaminathan et al., 2018 - Non-canonical mTOR-Independent Role of DEPDC5 in Regulating GABAergic Network Development
- Other Figures
- All Figure Page
- Back to All Figure Page
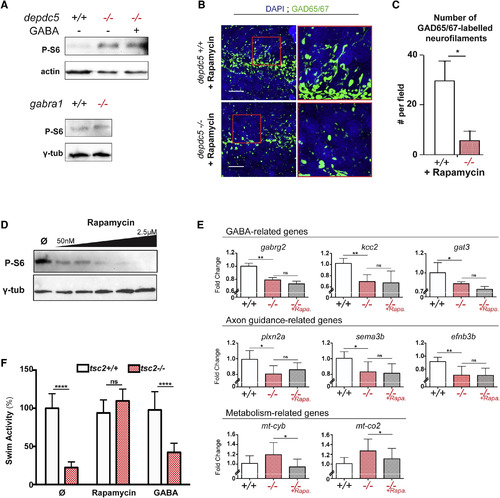
Figure 7. mTOR Deregulation and GABAergic Defects Are Independent Effects of Depdc5 Knockout (A) Western blotting of 7-dpf depdc5+/+ and depdc5−/− larval lysates shows no change in phospho-S6 levels upon GABA treatment (100 μM from 8 hpf; top). Western blotting of 7-dpf gabra1+/+ and gabra1−/− larval lysates shows no difference in mTOR signaling upon knocking out gabra1 (bottom). (B) Images of transverse sections of 7-dpf rapamycin-treated depdc5+/+ and depdc5−/− larvae immunostained with α-GAD65/67 and counterstained with DAPI. Section level is displayed in the schematic drawing. Regions indicated in red boxes have been magnified to show the branching defects. Rapamycin treatment was begun at 8 hpf: 100 nM from day 0 to 2, 300 nM from day 3 onward; n = 3/genotype. Scale bars, 10 μm. (C) Quantification of GAD65/67-positive neurofilaments in rapamycin-treated depdc5+/+ and −/− larval brain sections shows that rapamycin treatment does not rescue the reduced number of filaments in depdc5−/−. (D) Western blotting of 5-dpf larval lysates upon treatment with increasing concentrations of rapamycin (50 nM, 250 nM, 500 nM, 1 μM, and 2.5 μM) from 8 hpf to estimate phospho-S6 levels shows a dose-dependent decrease. Rapamycin-containing water was changed every day. (E) RT-qPCR-based estimation of some down- and upregulated genes involved in axon guidance, GABA synapse activity, and metabolism. ef1a expression was used for normalization; expression of depdc5+/+ was normalized to 1 (∗p < 0.05, ∗∗p < 0.01). (F) Swimming activity of 7-dpf tsc2 larvae treated with rapamycin and GABA (day 0 onward) over 5-min light/10-min dark phases, with the activity oftsc2+/+ larvae normalized to 100%, shows that rapamycin, but not GABA, can rescue the hypoactivity (Student’s t test, ∗∗∗∗p < 0.0001). |
| Genes: | |
|---|---|
| Antibodies: | |
| Fish: | |
| Conditions: | |
| Anatomical Terms: | |
| Stage Range: | Day 5 to Days 7-13 |
| Fish: | |
|---|---|
| Conditions: | |
| Observed In: | |
| Stage Range: | Day 5 to Days 7-13 |