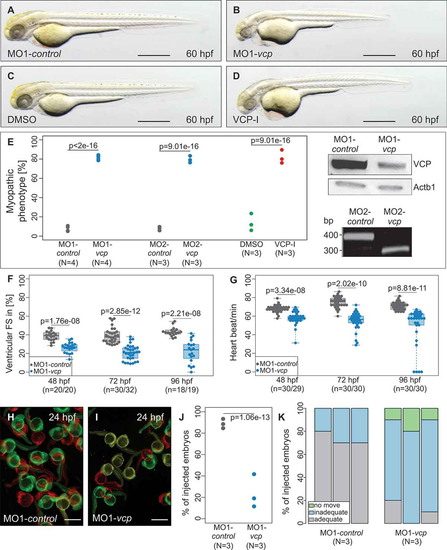
Phenotypic analysis of zebrafish after morpholino-mediated knockdown of vcp or ML240 treatment. (a to d) Lateral view of embryos at 60 hpf. Zebrafish embryos were either injected with 5 base pair (bp) mismatch vcp start morpholino (MO1-control; a) and vcp start MO (MO1-vcp; b) or treated with DMSO (c) and VCP-Inhibitor ML240 (VCP-I; d). scale bar: 500 μm (a, c); scale bar: 650 μm (b, d). (e) Statistical analysis of affected embryos after MO1/2-control or MO1/2-vcp injection and DMSO or ML240 treatment. N = 3/4 Experiments with in total n = 259 (MO1-control), n = 161 (MO2-control), n = 242 (MO1-vcp), n = 212 (MO2-vcp), n = 152 (DMSO), n = 148 (VCP-I); N two-sided Fisher exact tests combined with a modified Fisher method. Ratios of N experiments are displayed. MO1-vcp-injected embryos reveal reduced levels of Vcp by western blot analysis. Actb1/β-actin was used as loading control. RT-PCR after MO2-vcp injection shows specific effect on mRNA splicing. (f) Ventricular fractional shortening (FS) measurements of MO1-control and MO1-vcp-injected embryos at 48, 72 and 96 hpf, n = 18 to 30 (MO1-control), n = 19 to 32 (MO1-vcp). The individual measurements are shown (two-sided Wilcoxon rank-sum test). (g) Heart beat per minute at 48, 72 and 96 hpf of vcp morphants and control embryos. n = 30 (MO1-control), n = 29 or 30 (MO1-vcp). The individual measurements are shown (two-sided unpaired Wilcoxon rank-sum test. (h and i) False-colored superimposed overviews of spontaneous movement assay with MO1-control- (h) and MO1-vcp-injected (i) embryos at 24 hpf; red pictures = 0 s; green pictures = 10 s; yellow = merge. scale bar: 1 mm. (j) Quantification of spontaneous movement assay; N = 3 experiments with n = 30 (MO1-control), n = 29 or 30 (MO1-vcp) per experiment (N two-sided Fisher exact tests combined with modified Fisher method). The ratios of N experiments are shown. (k) Statistical analysis of touch-evoke flight response of control and vcp morphants at 72 hpf. n = 30, N = 3 (MO1-control), n = 29 or 30, N = 3 (MO1-vcp); data represent means.
|
