
Fig. 4
- ID
- ZDB-FIG-180720-4
- Publication
- Ji et al., 2018 - Directional selectivity of afferent neurons in zebrafish neuromasts is regulated by Emx2 in presynaptic hair cells
- Other Figures
- All Figure Page
- Back to All Figure Page
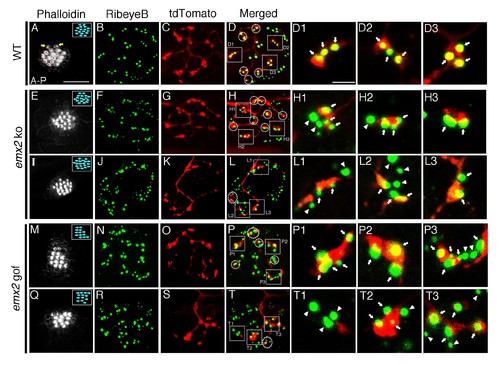
Association of single-labeled neurons with RibeyeB in emx2 mutants. (A–D) A wildtype neuromast with eight A > P (red asterisks), seven P > A, and two immature HCs (yellow arrows). (A) This neuromast shows a single neuroD:tdTomato labeled afferent neuron (C) that contacts only A > P HCs (red asterisks, A) that is stained with anti-RibeyeB antibody (B). (D) Merged labels of nerve endings and RibeyeB. (D1–D3) Expansion of square insets in (D) from selected 1 µm optical sections. (E–H3) A major neuroD:tdTomato afferent neuron (G) in an emx2 ko neuromast consisting of only P > A HCs (E) that is stained with RibeyeB antibody (F). (H) Merged labels of nerve endings and Ribeye. (H1–H3) Expansion of square insets of (H) from selected 1 µm optical sections. (I–L3) An emx2 ko neuromast (I) with a single minor neuroD:tdTomato-labeled afferent neuron (K) stained with RibeyeB antibody (J). (L) Merged labels of nerve endings and RibeyeB. (L1–L3) Expansion of square insets in (L) from selected 1 µm optical sections. (M–P3) A major afferent neuron (O) in an emx2 gof neuromast contacts only A > P HCs (M) stained wiht RibeyeB antibody (N). (P) Merged labels of nerve endings and RibeyeB. (P1–P3) Expansion of square insets in (P) from selected 1 µm optical sections. (Q–T3) A minor afferent neuron (S) in an emx2 gof neuromast that is stained with RibeyeB antibody (R). (T) Merged labels of nerve endings and RibeyeB. (T1–T3) Expansion of square insets in (T) from selected 1 µm optical sections. Squares and circles in (D,H,L,P,T) indicated all the HCs with RibeyeB label that are contacted by each fiber. White arrows and arrowheads show Ribeye puncta that are juxtaposed to labeled nerve endings or not, respectively. The number of neuromasts: WT, n = 8; emx2 ko major, n = 6, minor, n = 4; emx2 gof major n = 8, minor n = 7. Scale bar in (A) equals 10 μm and applies to all lower magnification images, and scale bar in (D1) equal 2.5 μm and applies to all higher magnification images. |