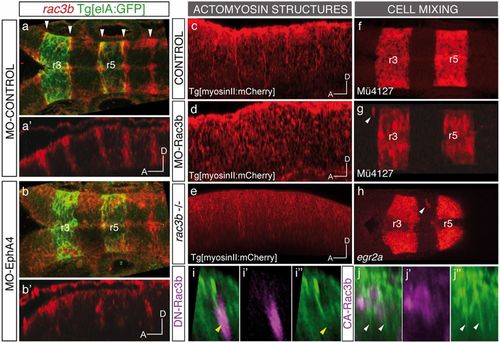
Expression and function of Rac3b in the hindbrain boundary cells. (A–B) Whole-mount in situ hybridization with rac3b in Tg[elA:GFP] embryos injected at the 1-cell stage with MO-Control (A and A′) or MO-EphA4 (B and B′), followed by anti-GFP staining. Note the expression of rac3b in boundary cells (white arrowheads) and how this expression diminishes upon EphA4 down-regulation. (A–B) Dorsal views and corresponding (A′–B′) sagittal views displaying only the red channel. (C–H) Loss of function of Rac3b, either by splicing blocking morpholino MO-Rac3b (D and G), or by CRISPR-Cas9 induced mutation (rac3b−/−) (E and H), results in the disruption of actomyosin cables (D and E) and cell mixing (G and H), compared with control embryos (C and F). White arrowheads in G and H point to ectopic r3/r5 rhombomeric cells. MO-Rac3b figures correspond to MO-Rac3bSBI4E5–injected Mü4127 embryos (Fig. S5C). Rhombomeric cell mixing in morphants was observed by expression of mCherry in r3 and r5 cells upon injecting the Mü4127 transgenic line. Cell mixing in rac3b−/− hindbrains was assessed by in situ hybridization with egr2a. (I–J) Sagittal views of representative examples of Tg[myosinII:GFP] embryos injected with the corresponding Rac3b construct, displaying either the merge (I–J) or the separate (I′–J′′) channels. (I–I′′) hs:DN-Rac3b-Myc clone (in magenta) hitting the rhombomeric boundary, with the subsequent disruption of the actomyosin cable; (J–J′′) hs:CA-Rac3b-Myc clone (in magenta) in rhombomere 5 generating ectopic actomyosin II structures. Yellow arrowheads in I–I′′ point to disrupted cables, and white arrowheads in J–J′′ indicate ectopic actomyosin structures. Anterior is to the left in all images.
|
