
FIGURE
Fig. 5
- ID
- ZDB-FIG-180711-44
- Publication
- Endlich et al., 2018 - The transcription factor Dach1 is essential for podocyte function
- Other Figures
- All Figure Page
- Back to All Figure Page
Fig. 5
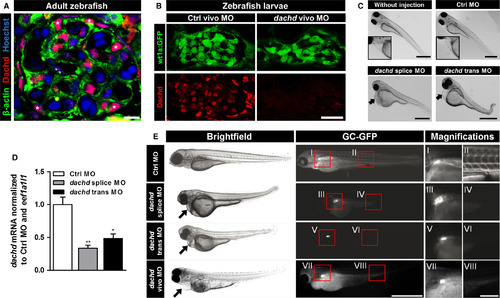
Knockdown (KD) of Dachd in zebrafish larvae compromised the glomerular filtration barrier. A, Expression of Dachd and β‐actin in mesonephric glomeruli of the adult zebrafish imaged by laser scanning microscopy. Paraffin sections were stained with Hoechst (DNA, blue) and with antibodies against β‐actin (green) and dachd (red). Scale bar represents 5 μm. B, Cryosections of 5 dpf wt1a:gfp zebrafish larvae showed a strong down‐regulation of Dachd expression after injection of dachd vivo morpholinos (MO). Scale bar represents 20 μm. C, Zebrafish eggs were injected with either control MO (Ctrl MO), dachd splice or trans MO. Brightfield images of zebrafish larvae (3 dpf) showed oedema formation after dachd splice or trans MO injection (arrows in C; n = 3). Scale bars represent 250 μm. D, The dachdmRNA was determined by qRT‐PCR analysis. Total mRNA extracts of whole larvae (3 dpf) injected with Ctrl MO (white bar), dachd splice (grey bar) or trans MO (black bar) (mean ± SEM, n = 5, 25 larvae per group) were used for cDNA synthesis. Data sets were normalized to Ctrl MO‐injected samples and the reference gene eef1a1l1. **P < .01, *P < .05. E, Studying the function of the glomerular filtration barrier by analysis of the GFP signals in CET larvae (wt1a:GFP x l‐fabp:GC‐GFP) in Ctrl, dachd splice and dachd trans MO‐injected larvae (3 dpf; n = 5) and dachd vivo MO‐injected larvae (6 dpf; n = 5). The fluorescence in the blood was reduced after the Dachd KD as a result of a leaky filtration barrier. In dachd splice, trans and vivo MO‐injected larvae only the green fluorescence of GFP‐positive podocytes was visible (I, III, V, VII: GFP‐expressing podocytes; II: GC‐GFP in blood vessels; IV, VI, VIII: leakage of the filtration barrier resulted in the loss of GC‐GFP). The dachd splice MO affects the correct splicing of the exon 2. The dachd trans and vivo MO binds in exon 1 of the dachd transcripts. Scale bars represent 250 μm, respectively, 50 μm (magnifications)
|
Expression Data
| Antibody: | |
|---|---|
| Fish: | |
| Anatomical Term: | |
| Stage: | Adult |
Expression Detail
Antibody Labeling
Phenotype Data
| Fish: | |
|---|---|
| Knockdown Reagents: | |
| Observed In: | |
| Stage Range: | 1-cell to Day 6 |
Phenotype Detail
Acknowledgments
This image is the copyrighted work of the attributed author or publisher, and
ZFIN has permission only to display this image to its users.
Additional permissions should be obtained from the applicable author or publisher of the image.
Full text @ J. Cell. Mol. Med.