
- Title
-
The transcription factor Dach1 is essential for podocyte function
- Authors
- Endlich, N., Kliewe, F., Kindt, F., Schmidt, K., Kotb, A.M., Artelt, N., Lindenmeyer, M.T., Cohen, C.D., Döring, F., Kuss, A.W., Amann, K., Moeller, M.J., Kabgani, N., Blumenthal, A., Endlich, K.
- Source
- Full text @ J. Cell. Mol. Med.
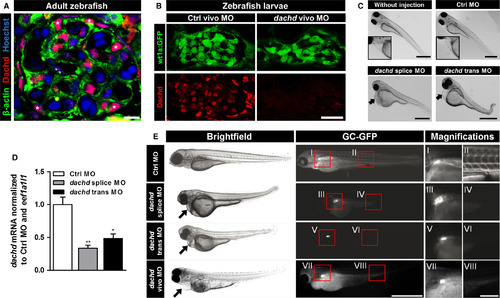
Knockdown (KD) of Dachd in zebrafish larvae compromised the glomerular filtration barrier. A, Expression of Dachd and β‐actin in mesonephric glomeruli of the adult zebrafish imaged by laser scanning microscopy. Paraffin sections were stained with Hoechst (DNA, blue) and with antibodies against β‐actin (green) and dachd (red). Scale bar represents 5 μm. B, Cryosections of 5 dpf wt1a:gfp zebrafish larvae showed a strong down‐regulation of Dachd expression after injection of dachd vivo morpholinos (MO). Scale bar represents 20 μm. C, Zebrafish eggs were injected with either control MO (Ctrl MO), dachd splice or trans MO. Brightfield images of zebrafish larvae (3 dpf) showed oedema formation after dachd splice or trans MO injection (arrows in C; n = 3). Scale bars represent 250 μm. D, The dachdmRNA was determined by qRT‐PCR analysis. Total mRNA extracts of whole larvae (3 dpf) injected with Ctrl MO (white bar), dachd splice (grey bar) or trans MO (black bar) (mean ± SEM, n = 5, 25 larvae per group) were used for cDNA synthesis. Data sets were normalized to Ctrl MO‐injected samples and the reference gene eef1a1l1. **P < .01, *P < .05. E, Studying the function of the glomerular filtration barrier by analysis of the GFP signals in CET larvae (wt1a:GFP x l‐fabp:GC‐GFP) in Ctrl, dachd splice and dachd trans MO‐injected larvae (3 dpf; n = 5) and dachd vivo MO‐injected larvae (6 dpf; n = 5). The fluorescence in the blood was reduced after the Dachd KD as a result of a leaky filtration barrier. In dachd splice, trans and vivo MO‐injected larvae only the green fluorescence of GFP‐positive podocytes was visible (I, III, V, VII: GFP‐expressing podocytes; II: GC‐GFP in blood vessels; IV, VI, VIII: leakage of the filtration barrier resulted in the loss of GC‐GFP). The dachd splice MO affects the correct splicing of the exon 2. The dachd trans and vivo MO binds in exon 1 of the dachd transcripts. Scale bars represent 250 μm, respectively, 50 μm (magnifications)
|

Knockdown (KD) of Dachd in zebrafish larvae affected podocyte gene expression and induced foot process effacement. A, Cryosections of 3 dpf zebrafish larvae showed an increase in Bowman's space (arrows) after the KD of Dachd (n = 3). Nephrin staining is shown in the middle panel. Scale bar represents 20 μm. B, Electron microscopy of Dachd KD and Ctrl morpholinos (MO) zebrafish larvae. Ctrl MO larvae showed a normally structured filtration barrier with intact foot processes (arrows). Foot processes of dachd vivo MO larvae were disordered with microvilli‐like structures (arrowheads) protruding in an increased Bowman's space (Bo). glomerular basement membrane and endothelial cells were also affected by MO treatment (circle). Scale bars represent 10 μm in the upper and 1 μm in the lower pictures. P, podocyte; E, endothelial cell; Ca, capillary. C, The expression of podocyte genes (synpo, nphs1 and nphs2) was determined by qRT‐PCR analysis. Total mRNA extracts of whole larvae (3 dpf) injected with Ctrl MO (white bars, means ± SD, n = 5), dachd splice MO (gray bars, means ± SD, n = 5) or dachd trans MO (black bars, means ± SD, n = 5) were used for cDNA synthesis. Data sets were normalized to Ctrl MO‐injected samples and the reference genes rpl13, eef1a1l1 and 18sRNA. ****P < .0001, ***P < .001, **P < .01, *P < .05
EXPRESSION / LABELING:
PHENOTYPE:
|

Dachd expression in glomeruli of 2 dpf and 3 dpf zebrafish larvae. Paraffin sections of 2 dpf and 3 dpf zebrafish larvae showed a strong dachd expression (red, middle lane). Scale bar represents 20 μm. EXPRESSION / LABELING:
|
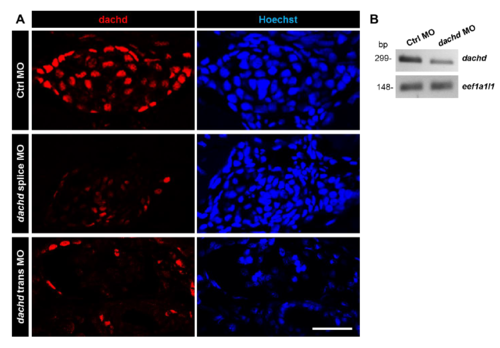
Confirmation of the dachd morpholino knockdown. (A) Paraffin sections of 3 dpf zebrafish larvae showed a strong downregulation of the dachd expression (red) due to the injection of a dachd splice and dachd trans MO, respectively. Scale bar represents 20 μm. (B) The dachd mRNA downregulation was shown by RT-PCR analysis. Total RNA of larvae (3 dpf) that were injected with Ctrl MO and dachd splice MO. |