
Fig. S1
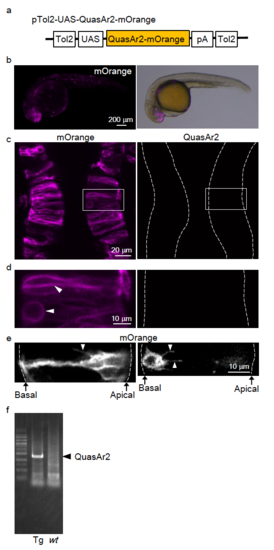
Transient expression of QuasAr2 and generation of QuasAr2 transgenic line. (a) Schematic diagrams of plasmid constructs for QuasAr2. (b) Lateral views of mOrange-expressing embryos at 1 dpf. (c) mOrange2 was localized to cell membranes in the neural tube, but QuasAr2 was not detected. Dorsal view of the neural tube of the injected embryos. (d) High magnification images of (c). Arrowheads indicate the localization of the fluorescence signal in cell membrane. (e) Representative images of the filopodia which are mOrange positive (arrowheads). (f) Genotyping results of UAS:QuasAr2 transgenic zebrafish. Tg: Tg(UAS:QuasAr2), wt: wild-type. gDNA isolated from the embryos of Tg(UAS:QuasAr2) F0 fish crossed with wild-type fish was used as the template for Tg. The cropped gel image is shown. The full-length gel is presented in Supplementary Fig. S6. |