
Fig. 3
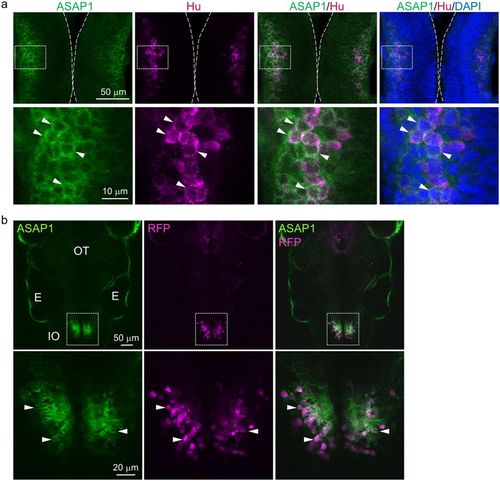
ASAP1 was expressed in neurons, including those of the cerebellum. (a) Horizontal sections of the neural tube of Tg(elavl3:GAL4-VP16;UAS:ASAP1) embryos stained with a HuC/D antibody and DAPI at 1 dpf. Hu-positive neurons (red) show a membrane-localized ASAP1 signal (arrowheads). Higher magnification images are shown in the lower panel. (b) ASAP1 was properly expressed in inferior olivary neurons. Dorsal view of the inferior olive (IO) of Tg(hspGFFDMC28C;UAS:ASAP1;UAS:RFP) fish (upper panel). Higher magnification images are shown in the lower panel. ASAP1 (green) is localized to the cell membranes of inferior olivary nuclei (red, arrowheads). Abbreviations indicate optic tectum (OT), and ear (E). |