
Fig. 4
- ID
- ZDB-FIG-180622-17
- Publication
- Di Donato et al., 2018 - An Attractive Reelin Gradient Establishes Synaptic Lamination in the Vertebrate Visual System
- Other Figures
- All Figure Page
- Back to All Figure Page
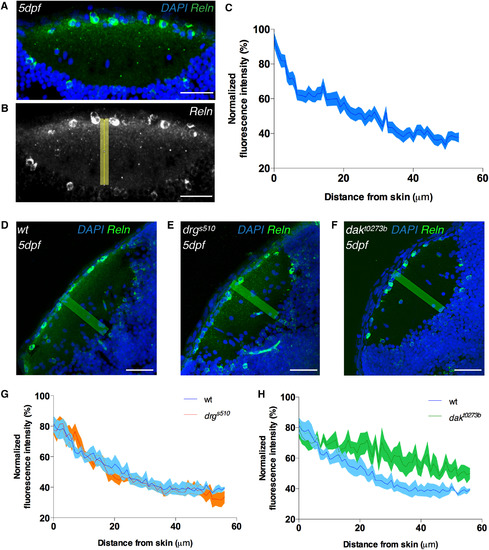
A Superficial-to-Deep Reelin Gradient Is Present in the Tectal Neuropil and Requires Heparan Sulfate Proteoglycans for Its Stabilization in the ECM (A) Immunostaining of anti-reelin (green) and DAPI (blue) on a horizontal cryo-section through a 5 dpf larval tectum. Reelin protein accumulates at the basement membrane (i.e., the tectal surface), and its concentration decreases perpendicular to the laminae in the neuropil toward the periventricular zone, where the cell bodies of PVNs reside. Scale bar, 30 μm. (B) Grayscale image of anti-reelin staining shown in (A) and the rectangle in yellow along which the Reelin gradient was measured. Scale bar, 30 μm. (C) Densitometric plot of normalized anti-reelin fluorescence in 5 dpf wild-type tecta showing a superficial-to-deep Reelin gradient. Data are represented as mean ± SEM, calculated from four samples out of four independent experiments. Reelin was also expressed in a few PVNs (see A and B), but this did not seem to cause any detectable disturbance of the Reelin gradient in the deep neuropil laminae. (D–F) Spatial distribution of Reelin protein in cryo-sectioned tecta of 5 dpf wild-type (D), drgs510 (type IV collagen LOF) (E), and dakt0273b (exostosin-2 LOF, glycosyltransferase involved in the heparan sulfate proteoglycans synthesis) (F) larvae. Anti-reelin staining is shown in green and DAPI counterstaining in blue. The yellow rectangles indicate along which direction the Reelin gradients for (G) and (H) were measured. Scale bars, 30 μm. (G) Densitometric plots of normalized anti-reelin fluorescence intensity taken from wild-type and drgs510 tecta. Data are represented as mean ± SEM, calculated from five samples per genotype. No difference in Reelin gradient distribution was seen between wild-type and drgs510 larvae. (H) Densitometric plots of normalized anti-reelin fluorescence intensity taken from wild-type and dakt0273b tecta (see D and F). Data are represented as mean ± SEM, calculated from five samples per genotype. A difference in Reelin gradient distribution was seen between wild-type and dakt0273b larvae, suggesting that heparan sulfate proteoglycans are required for Reelin gradient stabilization in the tectum. See also Figure S4. |
| Gene: | |
|---|---|
| Antibody: | |
| Fish: | |
| Anatomical Term: | |
| Stage: | Day 5 |
| Fish: | |
|---|---|
| Observed In: | |
| Stage: | Day 5 |