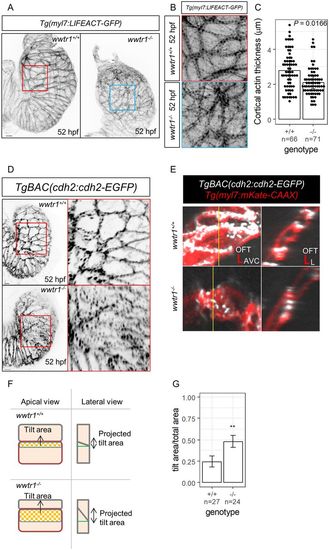
Disruptions to the architecture of the compact wall myocardium in wwtr1−/− hearts. (A) Maximum intensity projections of 52 hpf zebrafish hearts showing the overall expression pattern of LIFEACT-GFP, which marks F-actin localization (8/8 wwtr1+/+ and 6/7 wwtr1−/− hearts). Scale bars: 10 μm. (B) Apical views of cardiomyocytes corresponding to the area demarcated in their respective boxes in A. (C) Quantification of cortical actin thickness in ventricular cardiomyocytes. Each dot represents a cortical actin bundle (n cortical actin bundles were assessed from six wwtr1+/+ and seven wwtr1−/− hearts). P-value was calculated using a two-sample t-test. (D) Maximum intensity projections of 52 hpf zebrafish hearts showing the distribution of N-cadherin-GFP in ventricular cardiomyocytes. Nine out of 11 wwtr1+/+ hearts exhibit distinct N-cadherin-GFP localization to cardiomyocyte junctions, whereas 11/15 wwtr1−/− hearts exhibit punctate distribution of N-cadherin-GFP. Scale bars: 10 μm. (E) Apical views of cardiomyocytes and optical cross-section corresponding to the yellow vertical lines. The N-cadherin-GFP distribution in wwtr1−/− cardiomyocytes appears punctate along the cell junctions and the lateral contacts appear oblique to the apical surface (or ‘tilted’). OFT, outflow tract; AVC, atrioventricular canal; L, lumen. (F) Schematic illustration of E and strategy to quantify the ‘tilting’ of lateral contacts. The rectangle outlined in red is the ‘total area’, whereas the inner rectangle outlined in blue is the ‘tilt area’. The green horizontal line in the ‘lateral view’ is perpendicular to the apical surface. (G) Proportion of ‘tilt area’ to ‘total area’ of ventricular cardiomyocytes (n=total number of cardiomyocytes assessed from four hearts of each genotype). Error bars are one unit of standard deviation. **P<0.01 by two-sample t-test.
|
