
Fig. 2
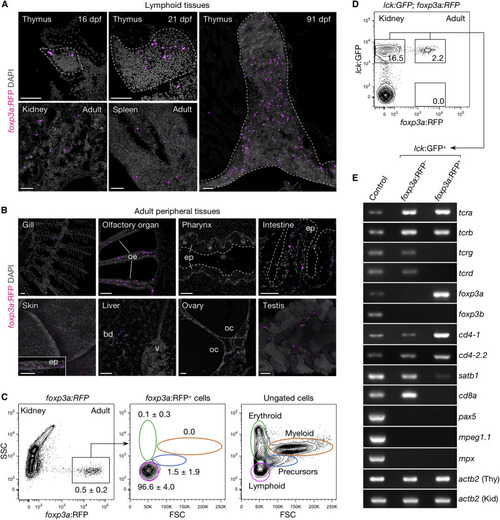
Distribution and Characterization of Zebrafish foxp3a+ Cells (A and B) foxp3a:RFP+ cells in lymphoid (A) and adult peripheral tissues (B). (C and D) FACS analysis of total kidney cells from adult foxp3a:RFP (C) and lck:GFP;foxp3a:RFP fish (D). The percentage of cells in each gate are indicated in the plots (C; mean ± SD, n = 5). The lymphoid gate from (C) is shown in (D). (E) Semi-qRT-PCR analysis of purified lck:GFP+foxp3a:RFP− (upper-left gate in D) and lck:GFP+foxp3a:RFP+ cells (upper-right gate in D). Thymus (Thy) and kidney (Kid) cell suspension was used as control for T cell genes and non-T cell genes. bd, bile duct; ep, epithelium; oe, olfactory epithelium; oc, oocyte; v, vein; FSC, forward scatter; SSC, side scatter. Scale bars, 50 μm. |
| Gene: | |
|---|---|
| Fish: | |
| Anatomical Terms: | |
| Stage Range: | Days 14-20 to Adult |
Reprinted from Developmental Cell, 43, Hui, S.P., Sheng, D.Z., Sugimoto, K., Gonzalez-Rajal, A., Nakagawa, S., Hesselson, D., Kikuchi, K., Zebrafish Regulatory T Cells Mediate Organ-Specific Regenerative Programs, 659-672.e5, Copyright (2017) with permission from Elsevier. Full text @ Dev. Cell