|
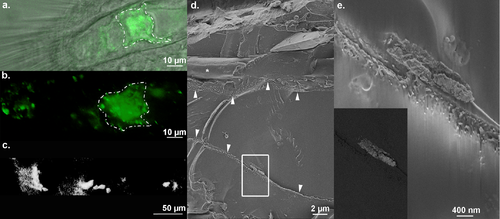
Tail area showing the unknown deposit revealed by calcein staining using confocal microscopy, micro-CT and cryo-SEM, observed in nacre zebrafish at 14 dpf. (a,b) Distal region of the body observed in top view using confocal microscopy reveals a positive staining localized in the nucleus pulposus cells (white dotted line). (c) In lateral view using micro-CT, we show that this positive staining is due to dense material. d,e. InLens secondary electron images using cryo-SEM in a longitudinal fracture of the notochord showing aggregates close to the notochord sheets (arrowheads). The collagen is found in close vicinity (white asterisks). e. Area magnified is delimited by the rectangle in panel d. Inset: Back-scattering electron imaging (BSE) of the same area observed in e
|