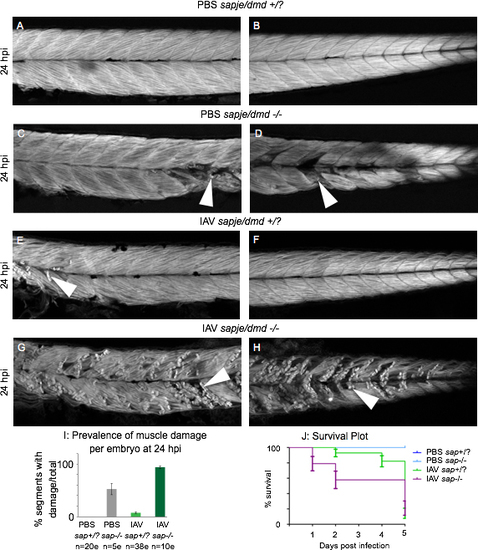
Muscle damage caused by IAV infection is exacerbated in the zebrafish model of DMD All embryo images are side mounts, dorsal top, anterior left of zebrafish at 24 hpi stained with phalloidin to visualize F-actin. White arrowheads point to foci of muscle damage. (A) Anterior muscle segments of a PBS-injected wild-type sibling embryo. (B) Posterior muscle segments of a PBS-injected wild-type sibling embryo. Note the lack of muscle damage present. (C) Anterior muscle segments of a PBS-injected sapje/dmd mutant embryo. (D) Posterior muscle segments of a PBS-injected sapje/dmd mutant embryo. Note that certain muscle segments in the anterior and the posterior have foci of muscle damage. (E) Anterior muscle segments of an IAV-injected wild-type sibling embryo. (F) Posterior muscle segments of an IAV-injected wild-type sibling embryo. Note the damaged fibers in the anterior muscle segments. (G) Anterior muscle segments of an IAV-injected sapje/dmd mutant embryo. (H) Posterior muscle segments of an IAV-injected sapje/dmd mutant embryo. Note the presence of damaged fibers in every imaged muscle segment of this embryo. (I) Quantification of the average number of muscle segments with damaged fibers per embryo at 24 hpi. Note that the prevalence of fiber damage in IAV-infected sapje/dmd mutants is more than would be predicted from adding the prevalence of damaged fibers of IAV-infected zebrafish and sapje/dmd mutants together. (J) Plot tracking survival for 5 days post injection. All PBS-injected wild-type siblings and sapje/dmd mutants lived for 5 dpi (blue lines). Most mortalities were observed in IAV-infected wild-type siblings between 4 and 5 dpi (green line). IAV-infected sapje/dmd mutants succumbed to the infection earlier than their wild-type siblings with more mortalities occurring on the first and second days post infection. Survival curves from individual experiments representative of three replicates.
|
