
Fig. 1
- ID
- ZDB-FIG-170921-27
- Publication
- Bergen et al., 2017 - The Golgi matrix protein giantin is required for normal cilia function in zebrafish
- Other Figures
- All Figure Page
- Back to All Figure Page
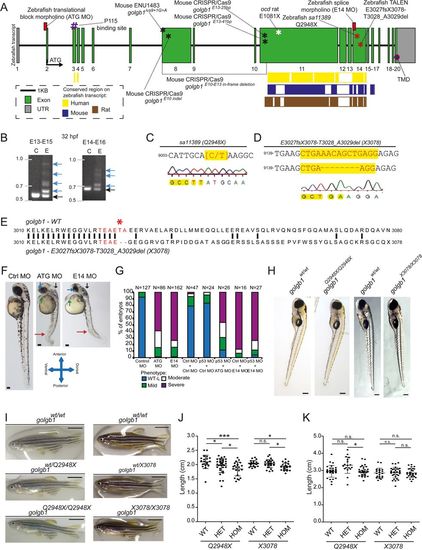
Experimental knockdown and knockout of giantin in vivo. (A) Schematic representation of the zebrafish golgb1 transcript (ENSDART00000131402.2) showing the binding sites of the designed morpholinos (ATG and E14), the relative exonic location of the human annotated p115 binding site, transmembrane domain (TMD), the various mouse mutants (black asterisks) and the ocd rat allele (white asterisk) as described in Lan et al. (2016), and Katayama et al. (2011), respectively. Coloured bars show the interspecies conserved sequence regions as assigned in Ensembl (release 87). Red asterisks indicate the location of zebrafish giantin mutant alleles. (B) Alternative spliced PCR products (blue arrows) from 32 hpf RT-PCR cDNA of two amplicons in E14 MO binding region. Black arrows indicate the expected size of PCR product. (C) Sa11389 line carrying a point mutation from C to T (yellow highlight, red letters) resulting in a premature stop codon at Q2948 (golgb1Q2948X) from the EZRC. (D) TALEN site directed mutagenesis resulted in an 8 bp deletion (spacer sequence in yellow, red letters), resulting in golgb1X3078 mutant line. (E) Alignment of Golgb1 WT protein sequence (Ensembl release 87) with predicted Golgb1 X3078 protein sequence showing translated spacer sequence (red) and site of deletion T3028 and A3029 with a subsequent frameshift from E3027 (red asterisk) changing 51 amino acids to a predicted stop codon at position 3078. Part of cDNA exon 14 sequence. (F) Stereomicroscope images of 48 hpf control, ATG, and E14 morphants exhibiting defects in the eye, heart, cranium, and various axis orientations (blue, green, black, red arrow, respectively). (G) Percentile quantification of scored phenotypes. (H) Stereomicroscope images of heterozygote in-cross 5 dpf larvae from both mutant lines and (I) 7 wpf female adults. (J) Dot plot for body length at 7 wpf, and (K) 44-46 wpf for golgb1Q2948X and 41-43 wpf for golgb1X3078 alleles. Scale bars: (F) 100 µm, (H) 200 µm, (I) 500 µm. (J, K) One-way ANOVA with Tukey's multiple comparison test. All experiments of three replicates. Bars show means with standard deviation. *P<0.05, and *** P<0.005. |
| Fish: | |
|---|---|
| Knockdown Reagents: | |
| Observed In: | |
| Stage Range: | Long-pec to Adult |