
Fig. 1
- ID
- ZDB-FIG-170815-6
- Publication
- Garcia et al., 2017 - Sheath Cell Invasion and Trans-differentiation Repair Mechanical Damage Caused by Loss of Caveolae in the Zebrafish Notochord
- Other Figures
- All Figure Page
- Back to All Figure Page
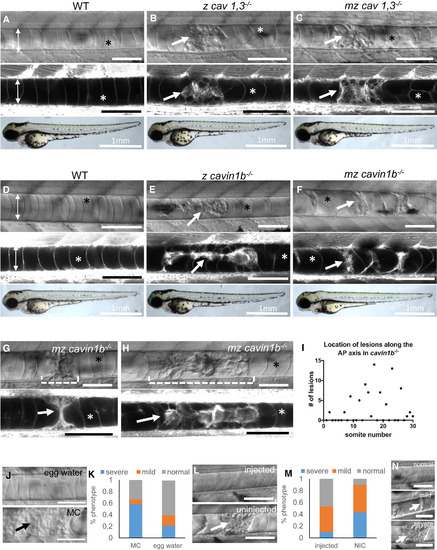
Loss of Caveolae Renders Notochord Vacuolated Cells Prone to Mechanical Disruption during Locomotion (A–F) DIC (top), confocal (middle), and bright-field images (bottom) of 72 hpf live MED-labeled WT, zygotic (z) cav1, 3−/−, maternal zygotic (mz) cav1, 3−/−, z cavin1b−/−, and mz cavin1b−/− larvae. (G and H) DIC and confocal images of a single live MED-labeled cavin1b−/− mutant at 72 (G) and 96 hpf (H). The dashed brackets mark an area with a notochord lesion that was imaged over time. (I) Distribution of notochord lesions along the anterior-posterior (AP) axis of 72 hpf z cavin1b−/− larvae (n = 30 fish). (J and K) 24 hpf embryos from a cavin1b+/− cross were de-chorionated and placed in 3% methyl cellulose (MC) or egg water and scored for notochord lesion severity at 72 hpf. p < 0.001, Fisher’s exact test; n = 83 (MC), n = 89 (egg water). (L and M) Embryos were injected with 200 pg α-bungarotoxin and scored at 72 hpf. p < 0.001, Fisher’s exact test; n = 94 (injected), n = 74 (non-injected control, NIC). (N) Classification of lesion severity. Scale bars, 100 μm unless marked otherwise. Double arrows mark the width of the notochord, arrows point to notochord lesions, and asterisks mark intact vacuoles. Error bars are SD. See also Figures S1–S4. |
| Fish: | |
|---|---|
| Observed In: | |
| Stage Range: | Protruding-mouth to Day 4 |