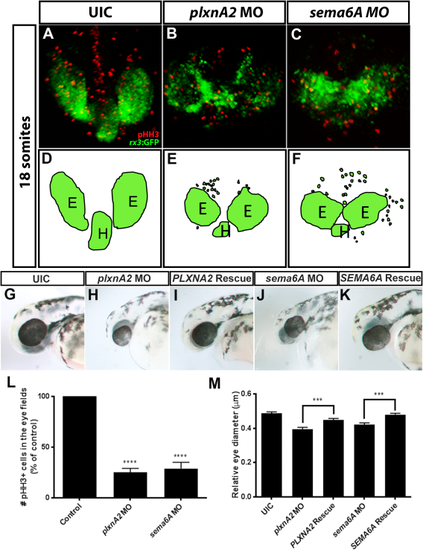
Sema6A and plxnA2 knockdown leads to loss of cohesion and decreased proliferation in eye vesicles. A–C: Confocal dorsal views of 18 somite stage rx3:GFP embryos co-labeled with pHH3. L: Both sema6A and plxnA2 morphants display ectopic retinal precursor cells outside of the eye field as well as significantly reduced pHH3 positive cells in the developing eyes compared with controls, as quantified (control 100%, N = 3, n = 30; plxnA2 MO 25.11% ± 0.72%, N = 3, n = 30, ****P < 0.0001; sema6A MO 28.86% ± 1.12%, N = 3, n = 30; ****P < 0.0001, one-way ANOVA, multiple comparisons post-hoc test). D–F: Schematics of rx3:GFP dorsal view. G,H,J,M: Decreased proliferation is later observed as smaller eyes at 48 hpf (control 0.49 μm ± 0.008 μm, N = 3, n = 30; plxnA2 MO 0.40 μm ± 0.01 μm, N = 3, n = 29, ****P < 0.0001; sema6A MO 0.42 μm ± 0.009 μm, N = 3, n = 31; ****P < 0.0001, one-way ANOVA, multiple comparisons test). G,I,K,M: Full length human PLXNA2 and SEMA6A mRNA partially rescues smaller eye phenotypes (control 0.49 μm ± 0.008 μm, N = 3, n = 30; PLXNA2 rescue 0.45 μm ± 0.009 μm, N = 3, n = 32, ***P < 0.001; SEMA6A rescue 0.48 μm ± 0.008 μm, N = 3, n = 28; ***P < 0.001, one-way ANOVA, multiple comparisons test. Error bars indicate SEM). E, eye; H, hypothalamus.
|
