
Fig. 2
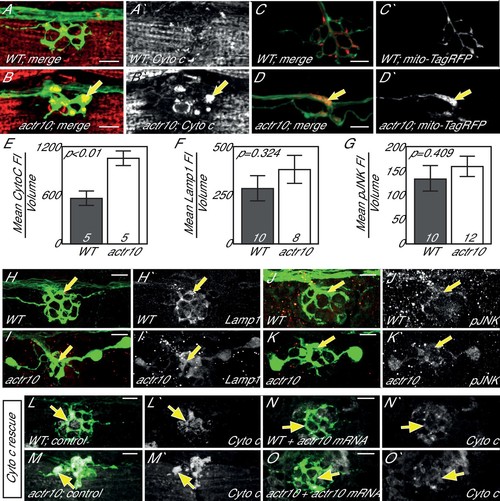
Loss of Actr10 causes mitochondrial accumulation in swollen axon terminals. (A,B) At 4 dpf, swollen axon terminals in actr10 mutants (B) have high levels of Cytochrome c immunolabeling (arrow; NM3 shown) relative to a wildtype sibling (A). (C,D) TagRFP-labeled mitochondria accumulate in actr10 mutant (arrow), but not wildtype, axon terminals at 4 dpf. (E) Mean fluorescence intensity (background subtracted) of Cytochrome C in axon terminals of A and B. (F,G) Mean fluorescence intensity (background subtracted) in axon terminals of H-K show comparable levels of Lamp1 and pJNK fluorescence intensity between wildtype and actr10 mutant terminals (ANOVA; mean ± SEM shown). (H–K) Lamp1 and pJNK immunolabeling in NM3 axon terminals (arrows). Lamp1 and pJNK are in red in (H–K) and white in H'-K'. (L–O) Mitochondrial accumulation in mutant axon terminals, assayed using Cytochrome c immunolabeling (white), can be suppressed by mRNA-mediated expression of mRFP-Actr10. Arrows point to axon terminal regions for comparison. Scale bars = 10 µm. |
| Antibodies: | |
|---|---|
| Fish: | |
| Anatomical Terms: | |
| Stage: | Day 4 |
| Fish: | |
|---|---|
| Observed In: | |
| Stage: | Day 4 |