
Fig. 3
- ID
- ZDB-FIG-170524-13
- Publication
- Albuixech-Crespo et al., 2017 - Molecular regionalization of the developing amphioxus neural tube challenges major partitions of the vertebrate brain
- Other Figures
- All Figure Page
- Back to All Figure Page
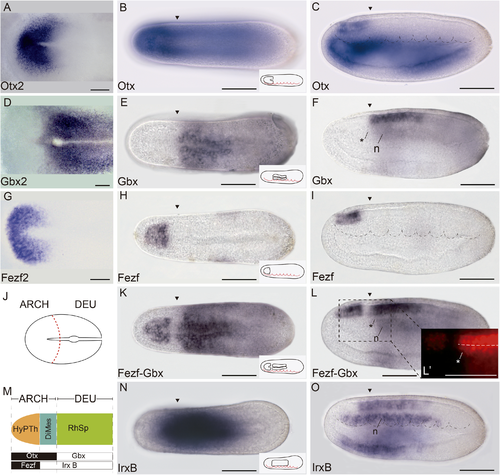
Three major molecular anteroposterior (AP) regions are observed in the incipient amphioxus neural tube. (A) Whole-mount in situ hybridization of chicken Otx2 at Hamburger–Hamilton 5 (HH5) stage. (B,C) Expression of amphioxus Otx at 21 h post fertilization (hpf) in dorsal (B) and lateral (C) views. (D) Whole-mount in situ hybridization of chicken Gbx2 at HH5 stage. (E,F) Expression of amphioxus Gbx at 21 hpf in dorsal (E) and lateral (F) views. G) Whole-mount in situ hybridization of chicken Fezf2 at HH5 stage. (H,I) Expression of amphioxus Otx at 21 hpf in dorsal (H) and lateral (I) views. (J) Schematic representation of HH5 chicken neural plate with the archencephalic prototagma (ARCH) and deuteroencephalic prototagma (DEU) domains depicted. The boundary between ARCH and DEU correspond to the border between Otx2 and Gbx2 expression patterns (A,D). (K,L) Double chromogenic in situ hybridization combining amphioxus Fezf and Gbx probes in dorsal (K) and lateral (L) views, showing two subdivisions in the amphioxus ARCH territory: a rostral hypothalamo-prethalamic primordium (HyPTh) domain (Fezf and Otx positive) and a caudal Di-Mesencephalic primordium (DiMes) domain (Fezf negative and Otx positive) (L′). (M) Schematic representation of the three major AP subdivisions in the amphioxus central nervous system (CNS) at the 21 hpf stage and the relative expression of their key markers. (N,O) Single chromogenic in situ hybridization with an amphioxus IrxB probe in dorsal (N) an lateral (O) views. Insets in B, E, H, K, and N depict the neural components of the corresponding gene expression patterns. Arrowheads mark the ARCH–DEU boundary, and asterisks mark the corresponding limit at the notochord level, based on Gbx expression. Abbreviations: n, notochord. Scale bar: 50 μm. |