
Fig. 2
- ID
- ZDB-FIG-170524-12
- Publication
- Albuixech-Crespo et al., 2017 - Molecular regionalization of the developing amphioxus neural tube challenges major partitions of the vertebrate brain
- Other Figures
- All Figure Page
- Back to All Figure Page
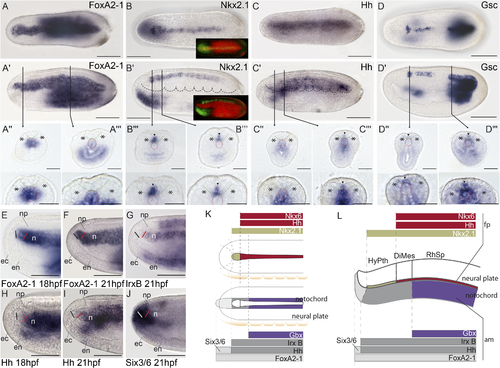
Molecular regionalization of the amphioxus floor plate and axial mesoderm. (A-A′′′) FoxA2-1 is expressed throughout the notochord, as shown by whole-mount in situ hybridization in dorsal (A) and lateral (A′) views and in situ hybridization in cryostat transversal sections (A′′,A′′′). (B-B′′′) Nk2.1 mRNA is expressed throughout the entire floor plate, as observed in dorsal (B) and lateral (B′) views, and in cryostat transversal sections (B′′,B′′′). Insets in (B) and (B′) show the combined FoxA2-1 and Nkx2.1 expression patterns using pseudocolors, indicating that Nkx2.1 is expressed above the notochord but does not reach its rostral boundary. (C-C′′′) Hh mRNA is detected in most of the floor plate, with exception of the rostral-most portion (hypothalamo-prethalamic primordium [HyPTh] floor plate) as observed in dorsal (C) and lateral (C') views, and in cryostat transversal sections (C′′, C′′′). (D-D′′′) Gsc expression is observed in different rostro-caudal patches in dorsal (D) and lateral (D′) views and in cryostat transversal sections (D′′, D′′′). E-J) Detailed analysis of the rostral end of the notochord using whole-mount data at 18 h post fertilization (hpf) and 21 hpf stages further supports that FoxA2-1 (E,F) is present throughout the entire length of the notochord; IrxB (G) and Hh (H,I) are absent rostrally and expressed caudally, and Six3/6 (I) is expressed only in the rostral tip. (K,L) The rostral molecular code (Six3/6 and FoxA2-1 positive, but IrxB and Hh negative) is summarized in dorsal (K) and lateral (L) schematic representations. In cryostat sections, asterisks mark somites, and arrowheads indicate neural expression; red and green dotted lines delineate the notochord and neural plate, respectively. Abbreviations: np, neural plate; ec, ectoderm; en, endoderm; n, notochord; fp, floor plate; am, axial mesoderm. Scale bar: 50 μm. |