
Fig. 2
- ID
- ZDB-FIG-170301-9
- Publication
- Reiten et al., 2017 - Motile-Cilia-Mediated Flow Improves Sensitivity and Temporal Resolution of Olfactory Computations
- Other Figures
- All Figure Page
- Back to All Figure Page
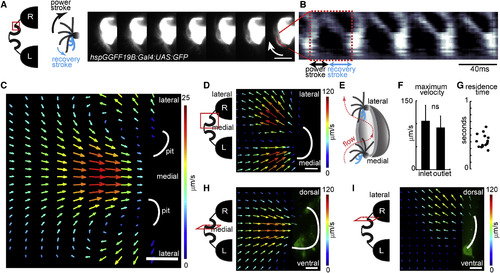
Motile Cilia Beat with an Asymmetric Stroke and Generate Stereotypical Flow Fields around the Nose (A) Beating pattern of two adjacent multiciliated cells, sparsely labeled with GFP (hspGGFF19B;UAS:GFP), recorded by light-sheet microscopy at 900 Hz. Red inlet on the left scheme marks the region of recording around the nose. Montage represents seven images separated by 4.5 ms on the right. Arrow marks the direction of beating. Note the asymmetric curvature of cilia during strokes, as exemplified in the model on the left. (B) Kymogram of pixel intensity along the red line shows an asymmetric beating pattern composed of a fast power stroke and a slow recovery stroke. A complete beating cycle has a period of 40 ms. (C) Flow fields are measured by particle image velocimetry using confocal microscopy images (2.15 Hz) of fluorescent particles around the nose pits (indicated by white lines) of 4-day-old zebrafish larvae. Imaging plane is viewed from dorsal. Warm colors and large arrows indicate strong flow. Direction of the arrows indicate the direction of the flow. Note that the stereotypical flow fields generated by motile cilia attract water from medial regions into the nose pits and eject it toward the lateral directions. (D) Close-up and faster (19.6 Hz) measurements of the dorsally viewed flow fields near the right nose pit. Note high flow rates of inflow (medially) and outflow (laterally) near the nose pits. Red inlet in the scheme on the left depicts the imaged region. (E) Model summarizing the directional orientation of asymmetrically beating motile cilia along the nose pits based on light-sheet microscopy measurements of individual sparsely labeled cilia from 11 animals. Cells located medially beat toward the pit. Cells located laterally beat toward the outside of the pit. (F) Maximal flow velocities at the inlet and outlet of the nose pits are not significantly different (15 nostrils from eight larvae). Error bars indicate the SD. (G) Residence times of particles in the nose pit measured in 15 nostrils from eight larvae, calculated based on inflow, outflow, and the volume of the nose pit. (H and I) Flow fields at the right nose pit laterally viewed at two different depths, (H) medial and (I) lateral, as indicated by red inlets in the left scheme. Foxj1a:GFP larvae were used (n = 4). Note that (H) at the medial plane inflow attracts water from all directions, and (I) at the lateral plane outflow ejects water mostly dorsally. Scale bars represent 10 μm (A), 100 μm (C), and 20 μm (D–I). p value by sign-rank test; ns, non-significant. See also Figure S2 and Movies S2 and S3. |
| Gene: | |
|---|---|
| Fish: | |
| Anatomical Terms: | |
| Stage: | Day 4 |