
Fig. 2
- ID
- ZDB-FIG-170125-11
- Publication
- Beretta et al., 2017 - Early Commissural Diencephalic Neurons Control Habenular Axon Extension and Targeting
- Other Figures
- All Figure Page
- Back to All Figure Page
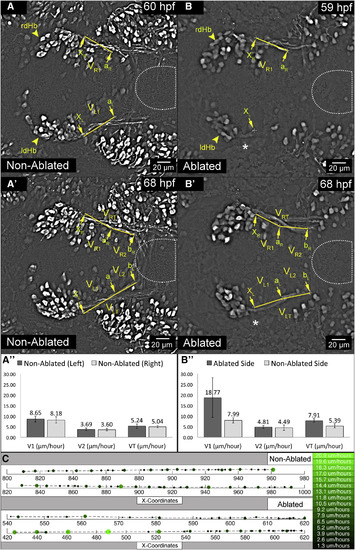
ThEPC Neurons Influence Initiation and Velocity of dHb Axon Elongation (A–B″) Dorsal views, anterior to the left, MIPs of two developmental stages acquired by in vivo 2-PM microscopy in (A and A′) non-ablated and (B and B′) left ThEPC-ablated Et(−1.0otpa:mmGFP)hd1 embryos. An asterisk marks the site of ablation. MIPs were adjusted using the difference of Gaussians to better visualize the structure of interest. The approximate location of the developing IPN is encircled. Yellow arrowheads highlight the position of dHb neurons. The original stacks were cropped and gamma was adjusted to a value of 0.60 for display purposes. Arrows on the right (R) and left (L) side indicate positions chosen for dHb axon growth measures. At positions xR and xL, dHb axons first emerge from the ThEPC in non-ablated embryos and on the non-ablated side in ablated embryos (not shown). aR and aL are the second position, which corresponds to the location of axon tips on the non-ablated side when axons on the ablated side reach xL. bR and bL are the third position, at which dHb axons stall in ablated embryos. VR, VL, VR1, VL1, VRT, and VLT symbolize axon elongation velocities in six (A″) non-ablated and (B″) ablated embryos. VLT and VRT were calculated by dividing the elongation distance of dHb efferent axons and time: (ΔxLbL)/Δt and (ΔxRbR)/Δt with VR1 or VL1 = (ΔxRaR or ΔxLaL)/Δt and VR2 or VL2 = (ΔaRbR or ΔaLbL)/Δt (see Table S1). The error bars represent the SD values of each velocity (V1, V2, VT). Note that measures were carried out in 2D projections and elongation velocity values are arbitrary. (C) Representative example of a 2D dHb axon-tracking plot generated using manual tracking data. Right axons are shown in the upper plot in non-ablated and ablated embryos, whereas the corresponding left axons are shown in the lower plot. Unilateral ablation was performed on the left. Larger and lighter green dots correspond to greater velocity. The right side bar shows the color-coded velocity in μm/hr. dHb, dorsal habenula; l, left; r, right; ThEPC, thalamic-epithalamic early projecting cluster. See also Figures S2–S4, Table S1, and Movie S3. |