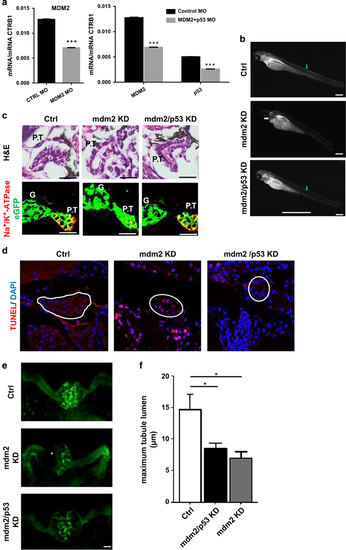
Mdm2 knockdown in zebrafish larvae. (a) After the treatment of fertilized zebrafish eggs with mdm2 MO, mdm2/p53MO, mRNA expressions of mdm2 or both mdm2 and p53 were significantly reduced in contrast to larvae treated with Ctrl MO. The target mRNA expression levels were determined by real-time RT-PCR and expressed as mean of the ratio versus the respective ctrb1 mRNA level±S.E.M. Data are means±S.E.M. ***P<0.005. (b) CADE larvae developed pericardial edema (white arrow) after the mdm2 KD in contrast to control morpholino-injected larvae (Ctrl) and mdm2/p53 morpholino-injected larvae. Mdm2 KD larvae showed a loss of the vascular eGFP fluorescence (green arrow) due to a leaky filtration barrier. Scale bar represents 50 μm. (c) Paraffin sections were stained with H&E and an antibody against Na+/K+–ATPase, respectively. Glomerulus (G), proximal tubule (P.T). Scale bar represents 20 μm. (d) TUNEL assay showed dead cells in the pronephric tubules of mdm2 KD larvae. Scale bar represents 20 μm. (e) 3D reconstructions of 2-PM z-stack showed dilated pronephric proximal tubules in mdm2 KD larva. Scale bar represents 20 μm. (f) The box plot histogram shows the significant dilatation of pronephros proximal tubule lumen of mdm2 KD larvae compared with Ctrl and mdm2/p53 KD larvae. Scale bar 20 μm
|
