
Fig. S2
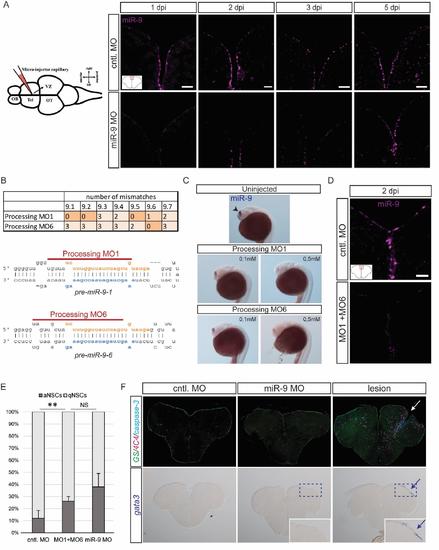
Validation of the specificity of the effect of miR-9 knock-down on NSCs, related to figure 2 (A) ISH using a miR-9 LNA probe (magenta) demonstrating efficient knock-down of miR-9 at 1, 2, 3 and 5dpi of the miR-9 vivoMO (bottom panel) when compared with the control vivoMO (bottom panel). Note that at 5dpi the vivoMO no longer has any effect. Scale bar=20μm. (B) Design of processing morpholinos. The table on the top displays the number of mismatches between the two morpholinos (MO1 and MO6) and the 7 different pre-miR-9 hairpins. The morpholinos were designed to efficiently target premiR-9 hairpins which are the most expressed in adult brains. Below, the two drawings present the target position of the two morpholinos around the Drosha processing sites on premiR-9-1 and pre-miR-9-6 hairpins. (C) ISH with miR-9 LNA probe (blue) showing effective knock-down of miR-9 by the processing morpholinos MO1 and MO6 injected in the zebrafish embryo at different doses (0.1mM and 0.5mM). At 24 hours post-fertilization (hpf), miR-9 is expressed in the embryonic telencephalon as seen in control embryos (top panel, arrowhead; Leucht et al., 2008). The processing morpholinos induce a dose-dependent decrease in mature miR-9 production (bottom panels). (D) ISH using a miR-9 LNA probe (magenta) demonstrating efficient knock-down of miR-9 at 2dpi of the processing vivoMOs into the adult brain ventricle (bottom panel) when compared with the control vivoMO (bottom panel). Scale bar=20μm. (E) Percentage of aNSCs (dark grey) and qNSCs (light grey) 2dpi of control vivoMO, processing vivoMOs or miR-9 vivoMO demonstrating significant increase in aNSCs. n=3 brains per condition; data are represented as mean ± 95% CI. (*) p<0.05, (**) p<0.01; one-way ANOVA with Bonferroni post-hoc correction (F) Immunostaining for GS (green), 4C4 anti-fish leukocytes (magenta) and cleaved caspase-3 (cyan) (top panels) and ISH with a gata3 probe (blue, bottom panels) following vivoMOs injections or a stab-wound lesion as a control of the stainings. No overt sign of acute inflammation or increased apoptosis is seen unpon vivoMO injections. |