
Fig. 4
- ID
- ZDB-FIG-161017-4
- Publication
- Hosseini et al., 2016 - Efferocytosis and extrusion of leukocytes determine the progression of early mycobacterial pathogenesis
- Other Figures
- All Figure Page
- Back to All Figure Page
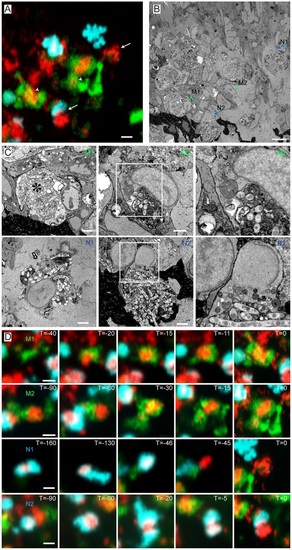
Ultrastructure of correlated macrophages and neutrophils in 3D serial block-face SEM images. (A) High-resolution CLSM image of an infected tail fin after live-cell imaging and fixation. (B) SBFSEM image of the same region as in A showing correlated macrophages (arrowheads) and neutrophils (arrows). (C) Higher magnification SBFSEM images of the two macrophages and two neutrophils indicated in A and B. (D) Frames from time-lapse imaging showing the macrophages and neutrophils in C at previous time points. The macrophage (M1) with a fragmented nucleus contains a high Mm content, indicated by the asterisk in C. This macrophage phagocytized the bacterial content ~30min before fixation. Macrophage M2 contains a large aggregate of Mm which was phagocytized Mm ~1.5h before fixation. Neutrophil N1 shows a rapid signal disappearance ~45min before the fixation (D). Neutrophil N2 was recruited to the bacterial aggregate ~30min before fixation (D). Scale bars: 10µm (A-C); 2µm (D). |
| Genes: | |
|---|---|
| Fish: | |
| Condition: | |
| Anatomical Terms: | |
| Stage: | Protruding-mouth |