
Fig. 2
- ID
- ZDB-FIG-160901-2
- Publication
- Casano et al., 2016 - Developmental Apoptosis Mediates Entry and Positioning of Microglia in the Zebrafish Brain
- Other Figures
- All Figure Page
- Back to All Figure Page
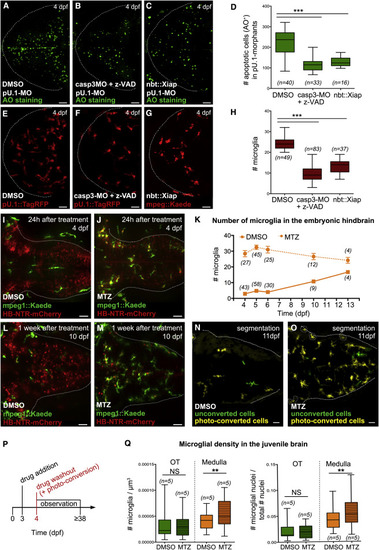
Neuronal Cell Death Affects Size and Distribution of the Microglial Population (A-D) AO staining (A-C) and quantifications (D) of apoptotic nuclei in 4-dpf pU.1-morphant embryos treated with DMSO (A), caspase-3-morpholino + z-VAD-fmk (B), and neuronal xiap overexpression (C) are shown. (E-H) Distribution (E-G) and quantification (H) of microglia in the optic tectum of 4-dpf pU.1::GAL4-UAS::TagRFP and mpeg1::GAL4-UAS::Kaede embryos treated with DMSO (E), caspase-3-morpholino + z-VAD-fmk (F), and neuronal xiap overexpression (G) are shown. (I, J, L, and M) Hindbrain dorsal views of an mpeg1::GAL4-UAS::Kaede;HB-NTR-mCherry embryo 24 hr (I and J) and 1 week (L and M) after treatment with DMSO or MTZ are shown. (K) Quantification of hindbrain microglia in mpeg1::GAL4-UAS::Kaede;HB-NTR-mCherry embryos, at different time points after pulsed treatment with DMSO or MTZ. Numbers indicate how many embryos have been analyzed. (N and O) Manual segmentation of photo-converted microglia (yellow cells) and new invading macrophages (green cells) in the hindbrain of a representative mpeg1::GAL4-UAS::Kaede;HB-NTR-mCherry larva 1 week after pulse of DMSO or MTZ and hindbrain microglia photo-conversion (original data in Figures S3I and S3J). NTR-mCherry+ neurons are omitted. Macrophages located superficially in the skin, outside the brain, are encircled with a white dotted line. (P) Experimental setup. At 3 dpf, NTR-mCherry+ embryos are treated with DMSO or MTZ. Then 24 hr later the drug is removed and hindbrain microglia are photo-converted. Microglia in the hindbrain are quantified at different developmental time points. (Q) Accumulation of microglia in the optic tectum and medulla oblongata of mpeg1::GAL4-UAS::Kaede;HB-NTR-mCherry juvenile fish, ~1 month after DMSO or MTZ treatment. Microglial densities are calculated as the number of microglia/micron3 or as the ratio between the number of microglia and the total number of nuclei. AO, acridine orange; OT, optic tectum; n, number of embryos or fish; NS, non-significant; **p < 0.01 and ***p < 0.001. Dotted lines delimit the regions of interest. For all quantifications, data are pooled from three independent experiments. Scale bar represents 30 µm. See also Figures S1, S2, and S3. |
| Genes: | |
|---|---|
| Fish: | |
| Conditions: | |
| Knockdown Reagent: | |
| Anatomical Terms: | |
| Stage Range: | Day 4 to Days 7-13 |
| Fish: | |
|---|---|
| Conditions: | |
| Knockdown Reagents: | |
| Observed In: | |
| Stage Range: | Day 4 to Days 30-44 |