
Fig. 2
- ID
- ZDB-FIG-160811-32
- Publication
- Antinucci et al., 2016 - A crystal-clear zebrafish for in vivo imaging
- Other Figures
- All Figure Page
- Back to All Figure Page
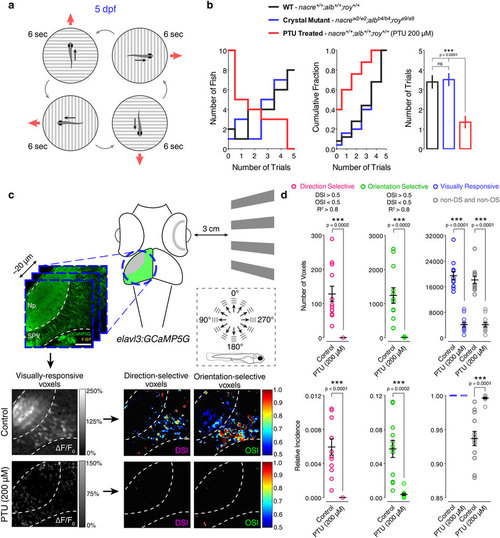
PTU impairs zebrafish behaviour and visual system function. (a) Schematic diagram illustrating the optomotor response behavioural assay. Individual 5 dpf larvae were positioned in a petri dish containing Danieau solution. An LCD screen controlled by a computer was used to display black and white square-wave gratings moving in 4 directions (red arrows) at the bottom of the petri dish. Each larva was tested 5 times in total (each trial lasted 6 seconds) and scored according to the trials it responded to (i.e., fish turns and swims in the direction of the moving gratings). (b) Quantification of the optomotor response assays for 5 dpf wild type (WT, black), crystal (blue) and PTU-treated (red) larvae (n = 25 larvae in each group). The frequency distribution (left), cumulative frequency distribution (centre) and mean ± SEM (right) of number of responsive trials per larva are reported. Note that PTU-treated larvae show a significant decrease in the number of trials they respond to. ns, non-significant; ***p < 0.001; one-way ANOVA with post-hoc Tukey’s HSD test. (c) Functional calcium imaging of tectal cells and retinal ganglion cell axons expressing GCaMP5G (green) in 4 dpf Tg(elavl3:GCaMP5G) larvae. Distance of right eye from projection screen is 3 cm. Recordings are performed from 3 Z-planes (approximately 20 µm total volume thickness) in the contralateral optic tectum at 4 Hz image acquisition rate. Dashed box shows the angles of moving bars relative to zebrafish larva orientation. Mean ΔF/F0 images of calcium recordings in untreated (control) and PTU-treated larvae followed by mapping of direction-selective (DS) and orientation-selective (OS) voxels are displayed. Np, neuropil; SPV, stratum periventriculare; DSI, direction selectivity index; OSI, orientation selectivity index. Scale bar is 40 µm. (d) Average number (top) and relative frequency (bottom) of DS, OS, visually responsive and non-DS/non-OS voxels per Z-plane in control and PTU-treated 4 dpf larvae (n = 12 larvae in each group). Criteria used to identify DS and OS voxels are reported at the top. Note the dramatic reduction in visually responsive, DS and OS voxels following 200 µM PTU treatment. Error bars are ± SEM. ***p < 0.001, unpaired two-tailed Student’s t test. |
| Fish: | |
|---|---|
| Condition: | |
| Observed In: | |
| Stage: | Day 5 |