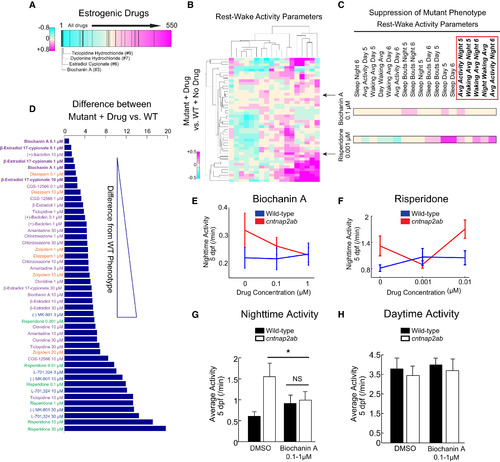
Biochanin A Reverses Nighttime Hyperactivity in cntnap2ab Mutants
(A) Rank-sorting of the anti-correlating data set with respect to estrogenic compounds shows significant enrichment of estrogenic agents in the top ranks (p = 0.0003 by random permutation). Black lines indicate drugs defined as having estrogenic activity (25 compounds in total).
(B) Hierarchical clustering of the behavioral fingerprints of cntnap2aΔ121/Δ121cntnap2bΔ31i/Δ31i larvae exposed to 14 psychoactive agents at three doses each relative to the wild-type + no drug fingerprint. Each rectangle in the clustergram represents the Z score of drug-exposed mutants relative to untreated wild-type (magenta, higher than wild-type; cyan, lower than wild-type).
(C) Magnified sections of the clustergram show relative suppression of the mutant fingerprint by biochanin A (0.1 μM) compared with risperidone (0.001 μM). The red box highlights parameters that measure nighttime activity.
(D) Pairwise Euclidean distances (“Differential Drug Effects”) between the mutant responses to psychoactive agents compared with untreated wild-type in the PCA (Figure S4G). Biochanin A (0.1 μM) produces the strongest suppression of the mutant phenotype in this assay, with the fewest effects on other behavioral parameters.
(E and F) Dose-response effects of biochanin A (E) and risperidone (F) on nighttime activity at 5 dpf (p = 0.0001, biochanin A; p = 0.0034, risperidone; two-way ANOVA, gene × drug interaction). Although there is some experimental variability in the baseline activity of both wild-type and mutant larvae, nighttime hyperactivity is consistently observed.
(G and H) Effect of the blind addition of biochanin A (0.1–1 μM) or DMSO on activity at night (G) and day (H) in the progeny of incrosses of cntnap2aΔ25/+cntnap2bΔ7/+ fish at 5 dpf. p = 0.045 (two-way ANOVA, gene × dose interaction).
|
