
Fig. 3
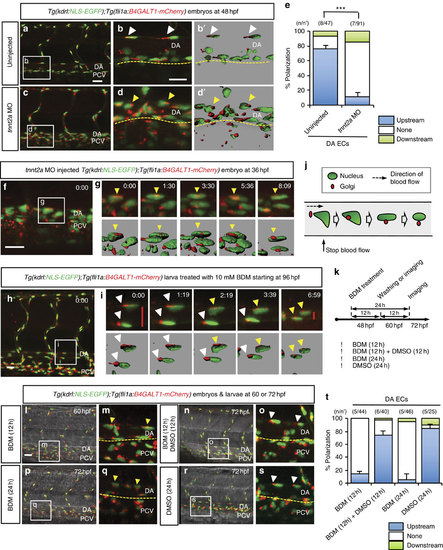
EC polarization by blood flow is reversible. (a-d′) Three-dimensional-rendered confocal stack images of 48 h.p.f. Tg(kdrl:NLS-EGFP);Tg(fli1a:B4GALT1-mCherry) embryos uninjected (a,b,b′) or injected with tnnt2a MO (c,d,d′). White boxes in left panels (a,c) enlarged in middle panels (b,d). (b′,d′) Surface-rendered images of boxed regions. White arrowheads point to polarized ECs and yellow arrowheads point to non-polarized ECs. Yellow dashed lines indicate ventral boundary of DA. (e) Quantification of EC polarization. Numbers of larvae (n) and ECs (n′) indicated above the graph. (f) Three-dimensional-rendered confocal stack images of 36 h.p.f. Tg(kdrl:NLS-EGFP);Tg(fli1a:B4GALT1-mCherry) embryo injected with tnnt2a MO. (g) Time-lapse confocal images of white boxed region in (f) surface-rendered images displayed below; yellow arrowheads point to non-polarized ECs; time (hours:minutes) shown in the top right corner of the images. (h) Three-dimensional-rendered confocal stack images of Tg(kdrl:NLS-EGFP);Tg(fli1a:B4GALT1-mCherry) larva treated with 10 mM BDM starting at 96 h.p.f. (i) Time-lapse confocal images of white boxed region in (h) surface-rendered images displayed below; white arrowheads point to polarized ECs and yellow arrowheads point to depolarized ECs; red bars indicate diameter of the DA; time (hours:minutes) shown in the top right corner of the images. (j) Schematic representation of EC depolarization when blood flow stops. (k) Schematic time table of BDM treatment of Tg(kdrl:NLS-EGFP);Tg(fli1a:B4GALT1-mCherry) embryos before 72 h.p.f.. (l-s) Three-dimensional-rendered confocal stack images of Tg(kdrl:NLS-EGFP);Tg(fli1a:B4GALT1-mCherry)embryos and larvae treated with 10 mM BDM for 12 h (l,m) or 10 mM BDM for 12 h, then dimethylsulfoxide (DMSO) for 12 h (n,o), or treated continuously with 10 mM BDM (p,q) or DMSO (r,s) for 24 h. White arrowheads point to polarized ECs and yellow arrowheads point to non-polarized ECs. (t) Quantification of EC polarization of 60 or 72 h.p.f. Tg(kdrl:NLS-EGFP);Tg(fli1a:B4GALT1-mCherry embryos and larvae treated with BDM for 12 h, BDM for 12 h then DMSO for 12 h, BDM for 24 h and DMSO for 24 h. Numbers of larvae (n) and ECs (n′) are indicated above the graph. Anterior to the left, dorsal to the top. Scale bars, 20 µm. DA, dorsal aorta; PCV, posterior cardinal vein. Error bars, s.e.m. |
| Genes: | |
|---|---|
| Fish: | |
| Condition: | |
| Knockdown Reagent: | |
| Anatomical Terms: | |
| Stage Range: | Prim-25 to Day 4 |